Detecting life changes from step counts
I moved to Toronto last year. Again. For the past few years, my life has mostly been moving. Dublin, Waterloo, Toronto, London, and Toronto again.
It started out as a kind of quest for adventure. I wanted to see new places, and studying abroad was the easiest way to do it. Eventually, moving became a more rational choice. By basic set operations, opportunities are always more limited in a subset of the world than in all of it.
As I’ve meandered through the English speaking world, various devices and online accounts have been collecting data on my daily routines. I was curious to what extent a simple metric like daily step count can be used to identify major changes in my life.
Introduction to Changepoint Detection
Changepoint detection is a statistical approach to determining when there’s a change in the underlying process that generates data. We observe a series of observations over time, and would like to infer when the observations start to be consistently lower or higher than before.
The classic example of this is industrial processes. Imagine you’re producing bolts. You can tolerate some variability in the length of the bolt, but on average you’d like them to be a certain length. If something changes so the machine produces longer or shorter bolts, you’d like to be notified.
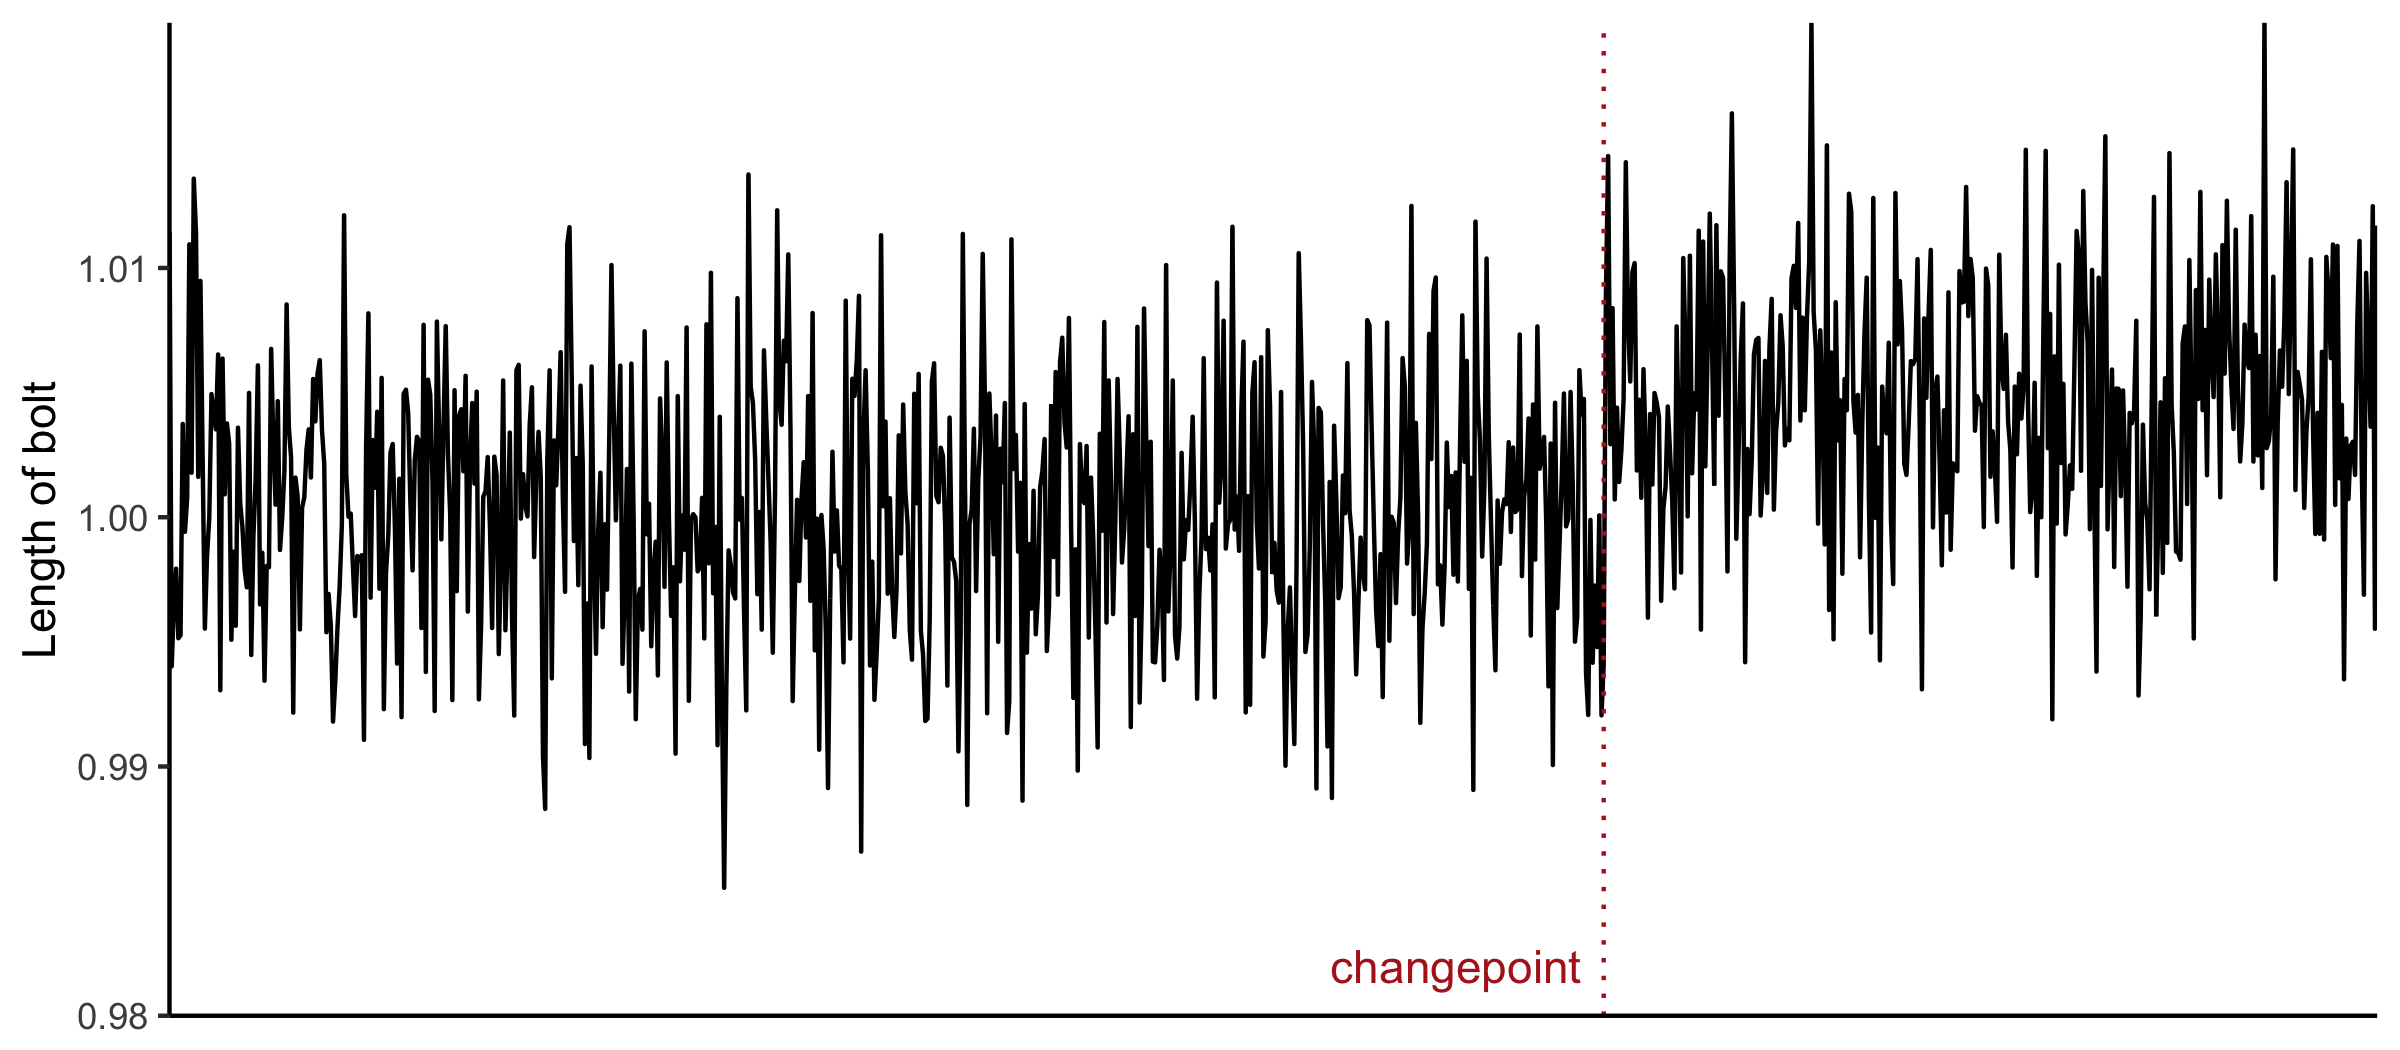
This is where changepoint analysis comes in. Given a series of independent data points \(X_1, X_2, ..., X_n\), we’re interested in splitting the data into segments, so that within each segment the \(X_i\) follow the same distribution.
\[ X_i \sim F_k(x) \text{ for some breakpoints } \tau_{k-1} \leq i \leq \tau_k \]
There are various approaches to this problem. In the simplest case, we can assume the same parametric distribution for all \(F_k(x)\) and test for a change in a parameter. For example, we can assume \(X_i \sim N(\mu_k, \sigma)\) and test for changes in the mean.
Zou et al. developed a non-parametric approach. Instead of only testing for a change in one parameter, they test for a change in the full distribution by using a neat binomial trick. If we have a series of independent observations from some distribution \(F_0\), the number of the observations that exceed a given value \(u\) is given by the binomial distribution.
\[ X_1, ..., X_N \sim F_o(X) \implies \#\{X_i \leq u\} \sim \text{Binomial}(N, F_0(u)) \]
They integrate over this binomial distribution for different values of the threshold u, and use it as a segment-wise likelihood function. The overall likelihood function is then obtained by summing over all the different segments. To avoid overfitting, a penalty term limits the number of changepoints that are identified.
I set out to apply this method on the most consistent personal data I have: my iPhone step counts.
Three Years of House Moves
I got my phone in the winter of 2016. For the most part, my phone has been kept collecting data since. There was one period in 2016 and one in 2017 where the step counting was turned off.
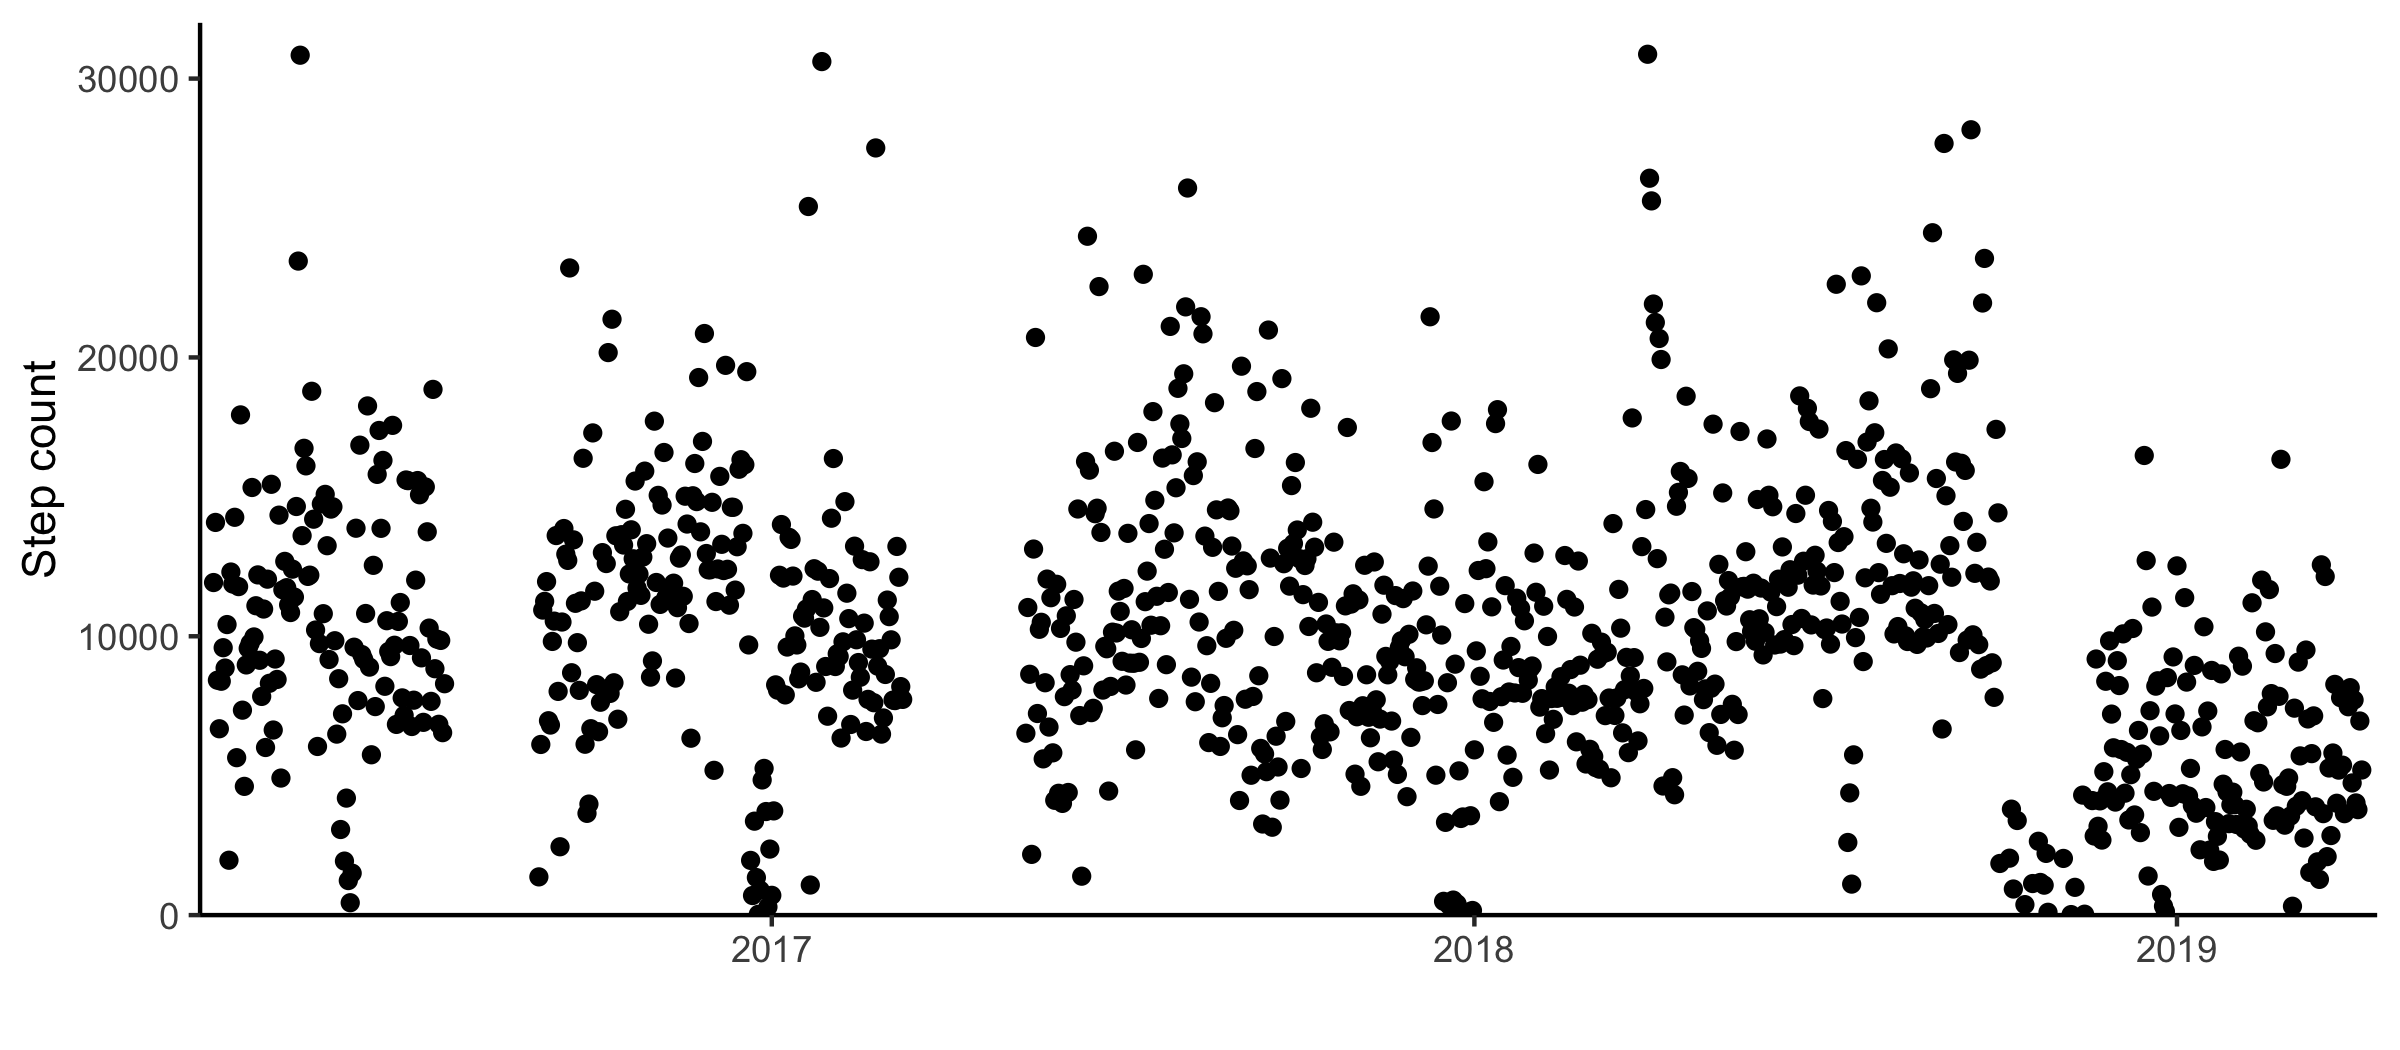
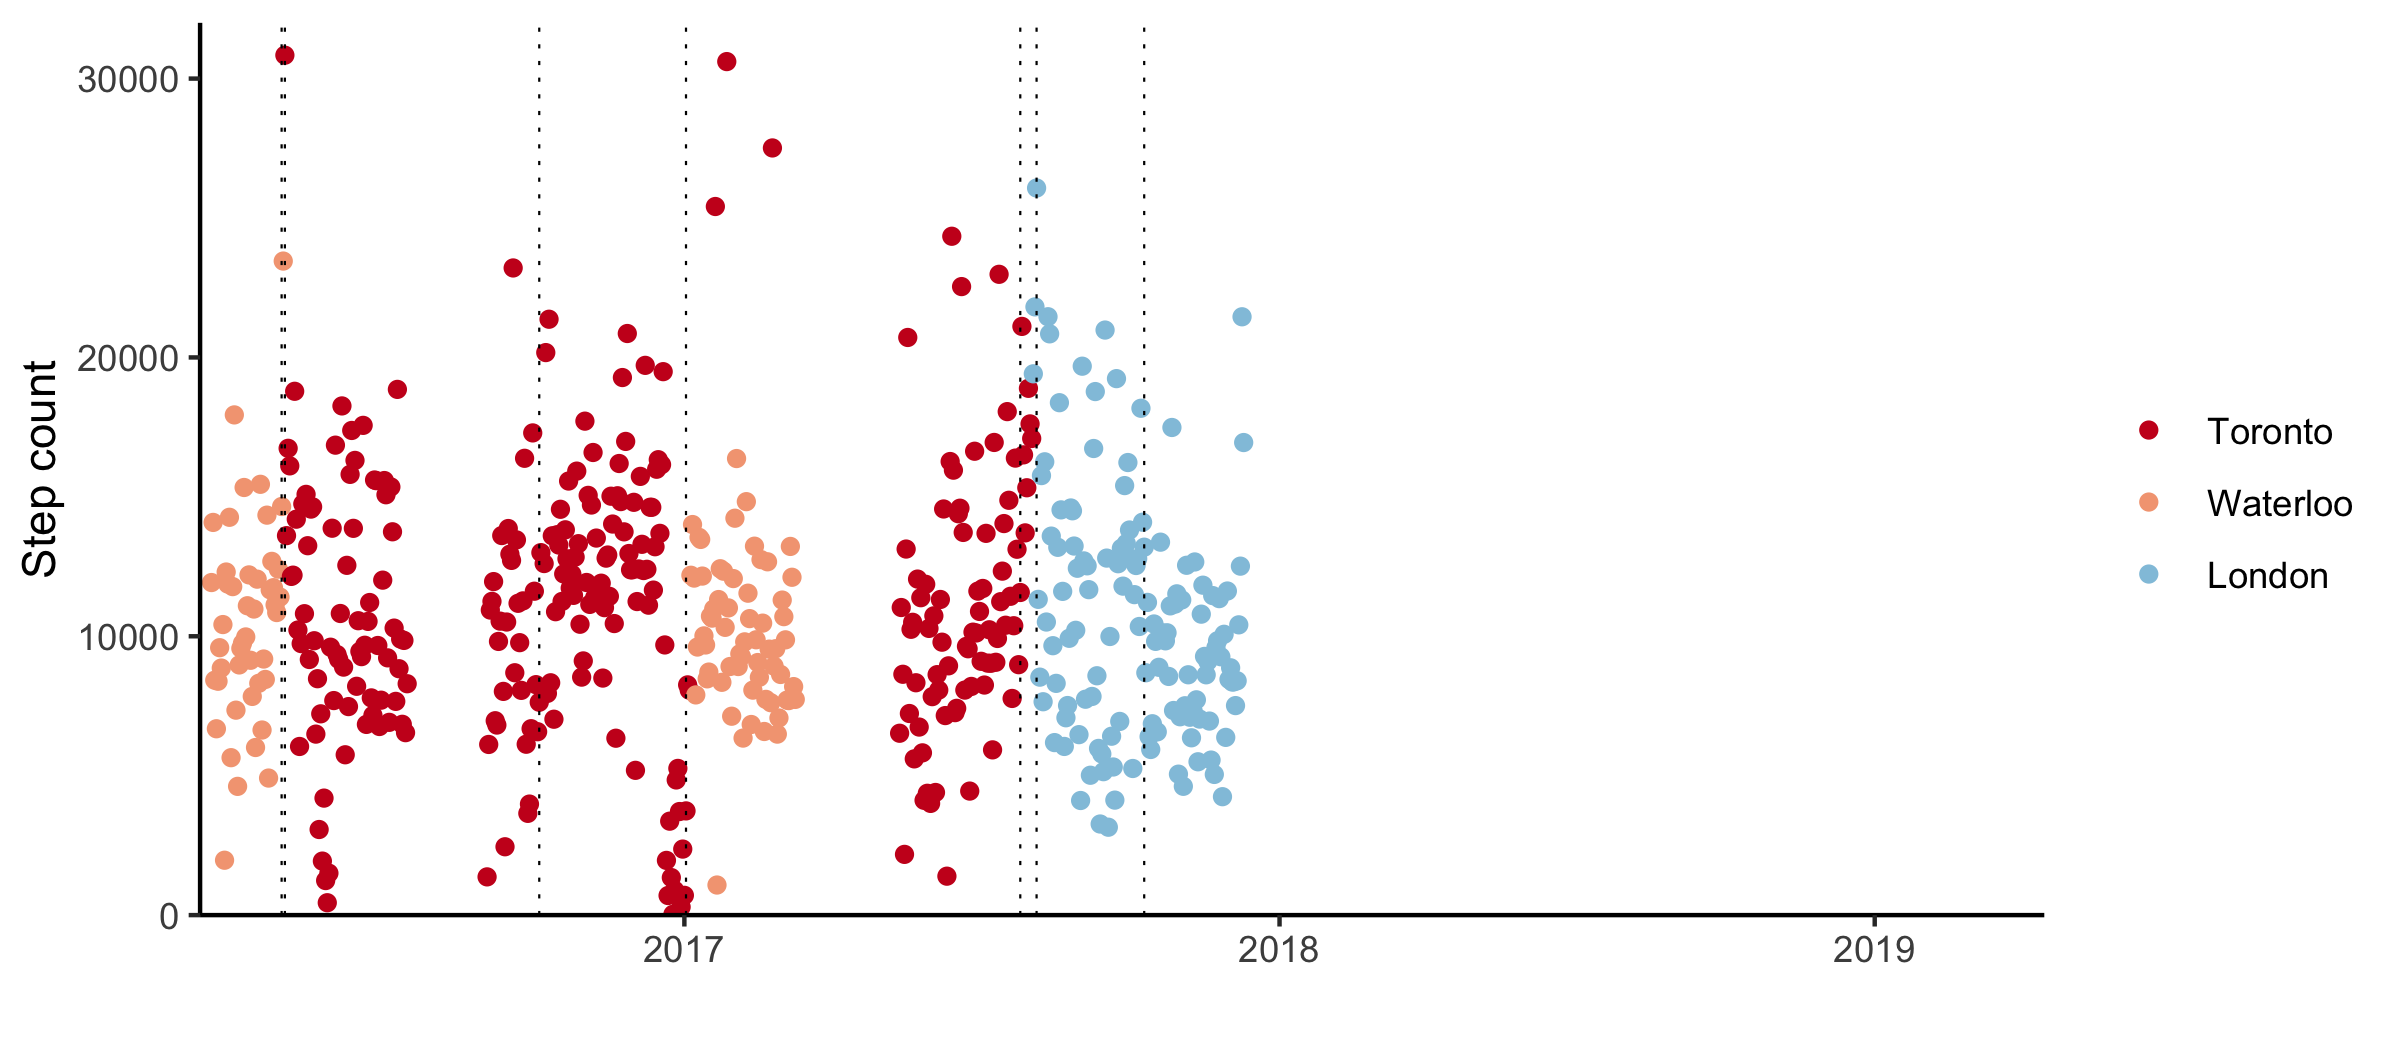
The nonparametric changepoint detection method is available through the R package changepoint.np1. Applying the algorithm with the default modified Bayesian information criterion penalty (Zhang et al. 2007) results in 18 changepoints.
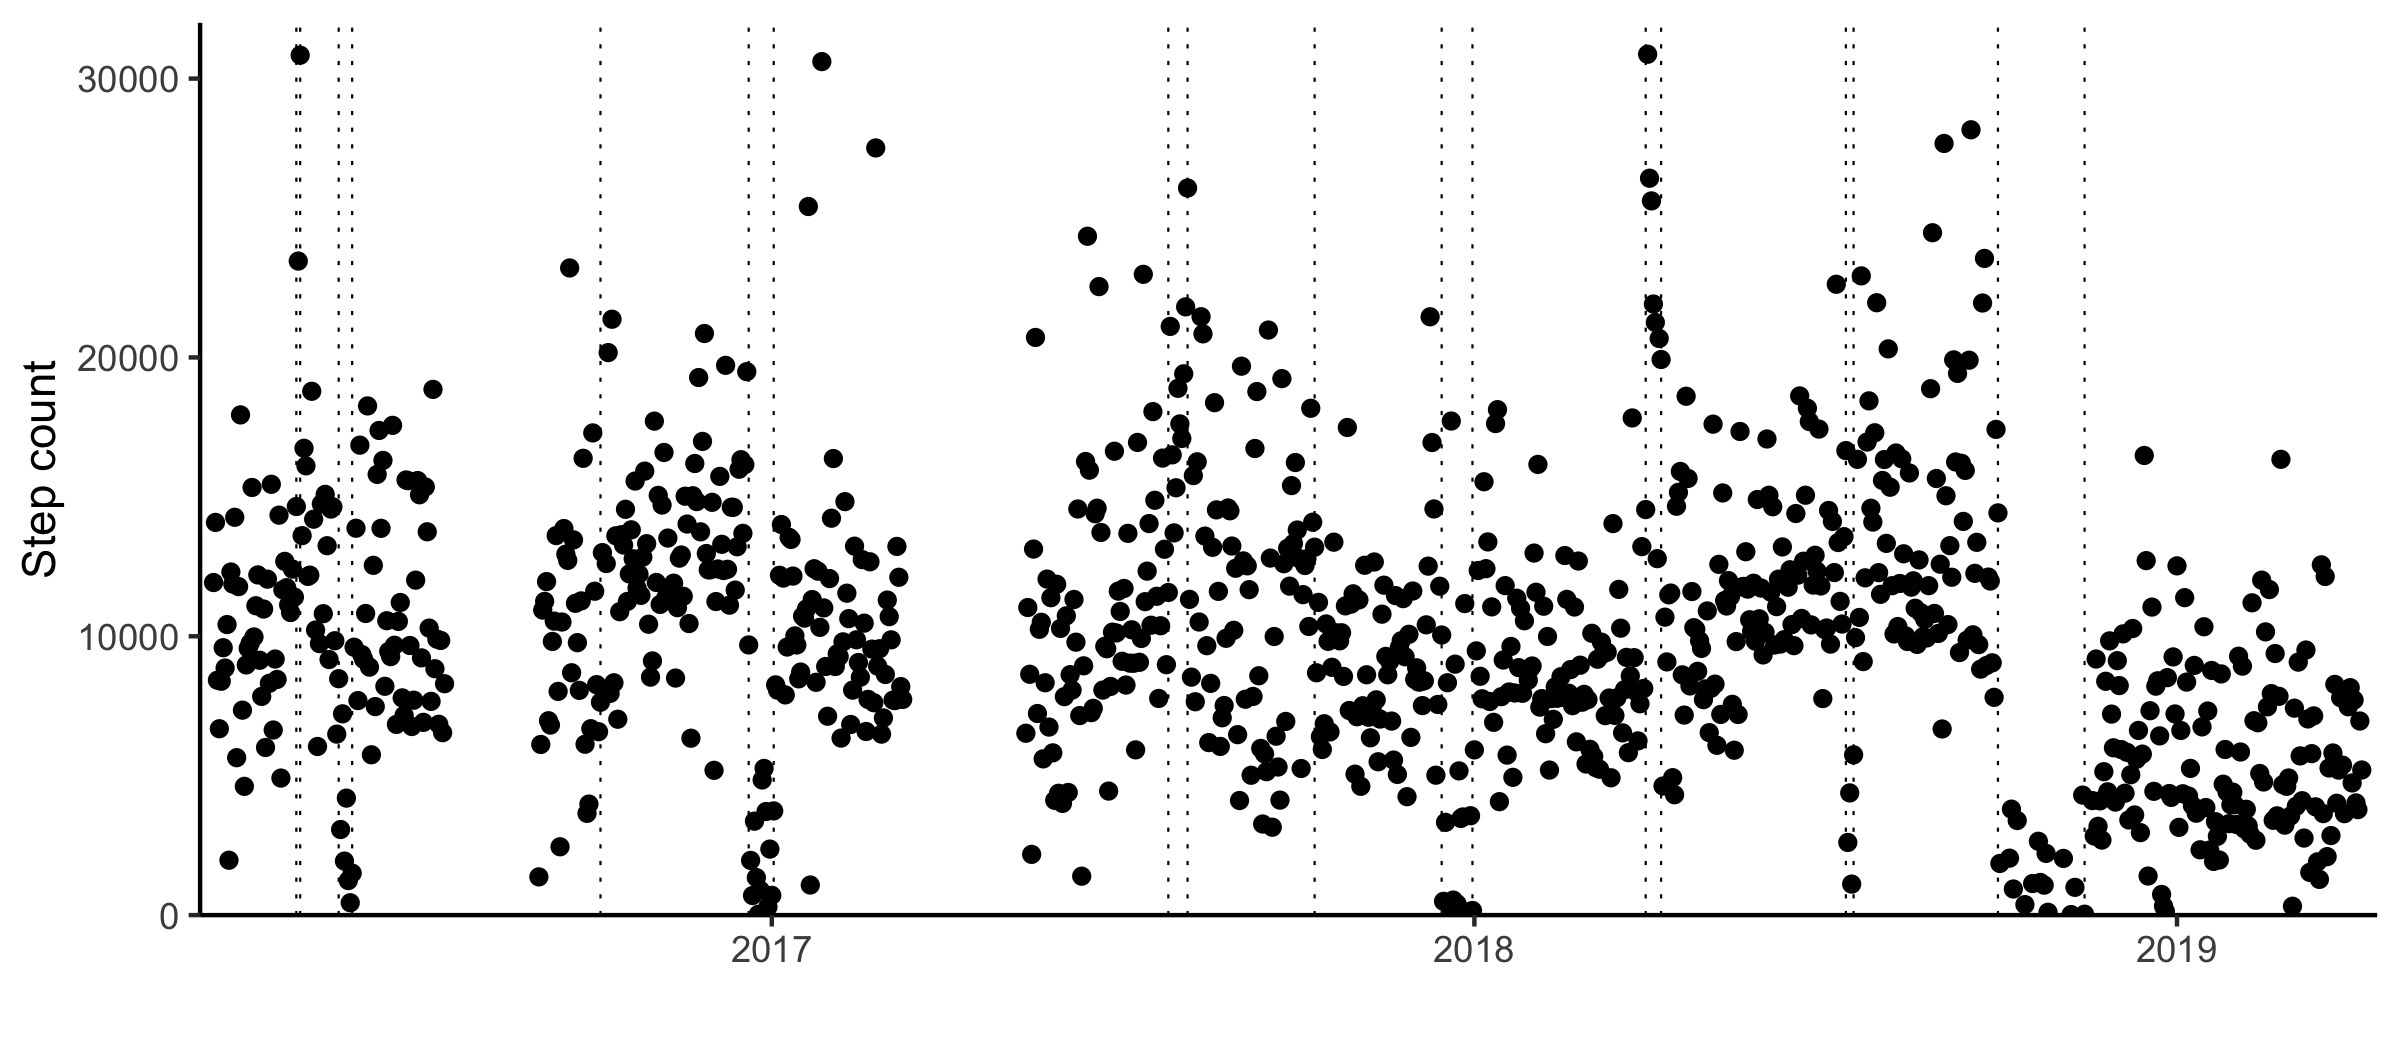
For the most part, these are aligned to major moves.
A few months after I bought my phone, I moved to Toronto to start a placement at a cancer research institute. I was studying biostatistics and got sent out to try my skills in a bioinformatics lab. I struggled to understand what cancer was and got very good at making heatmaps. For the first bit, I lived in the University of Toronto student housing downtown.
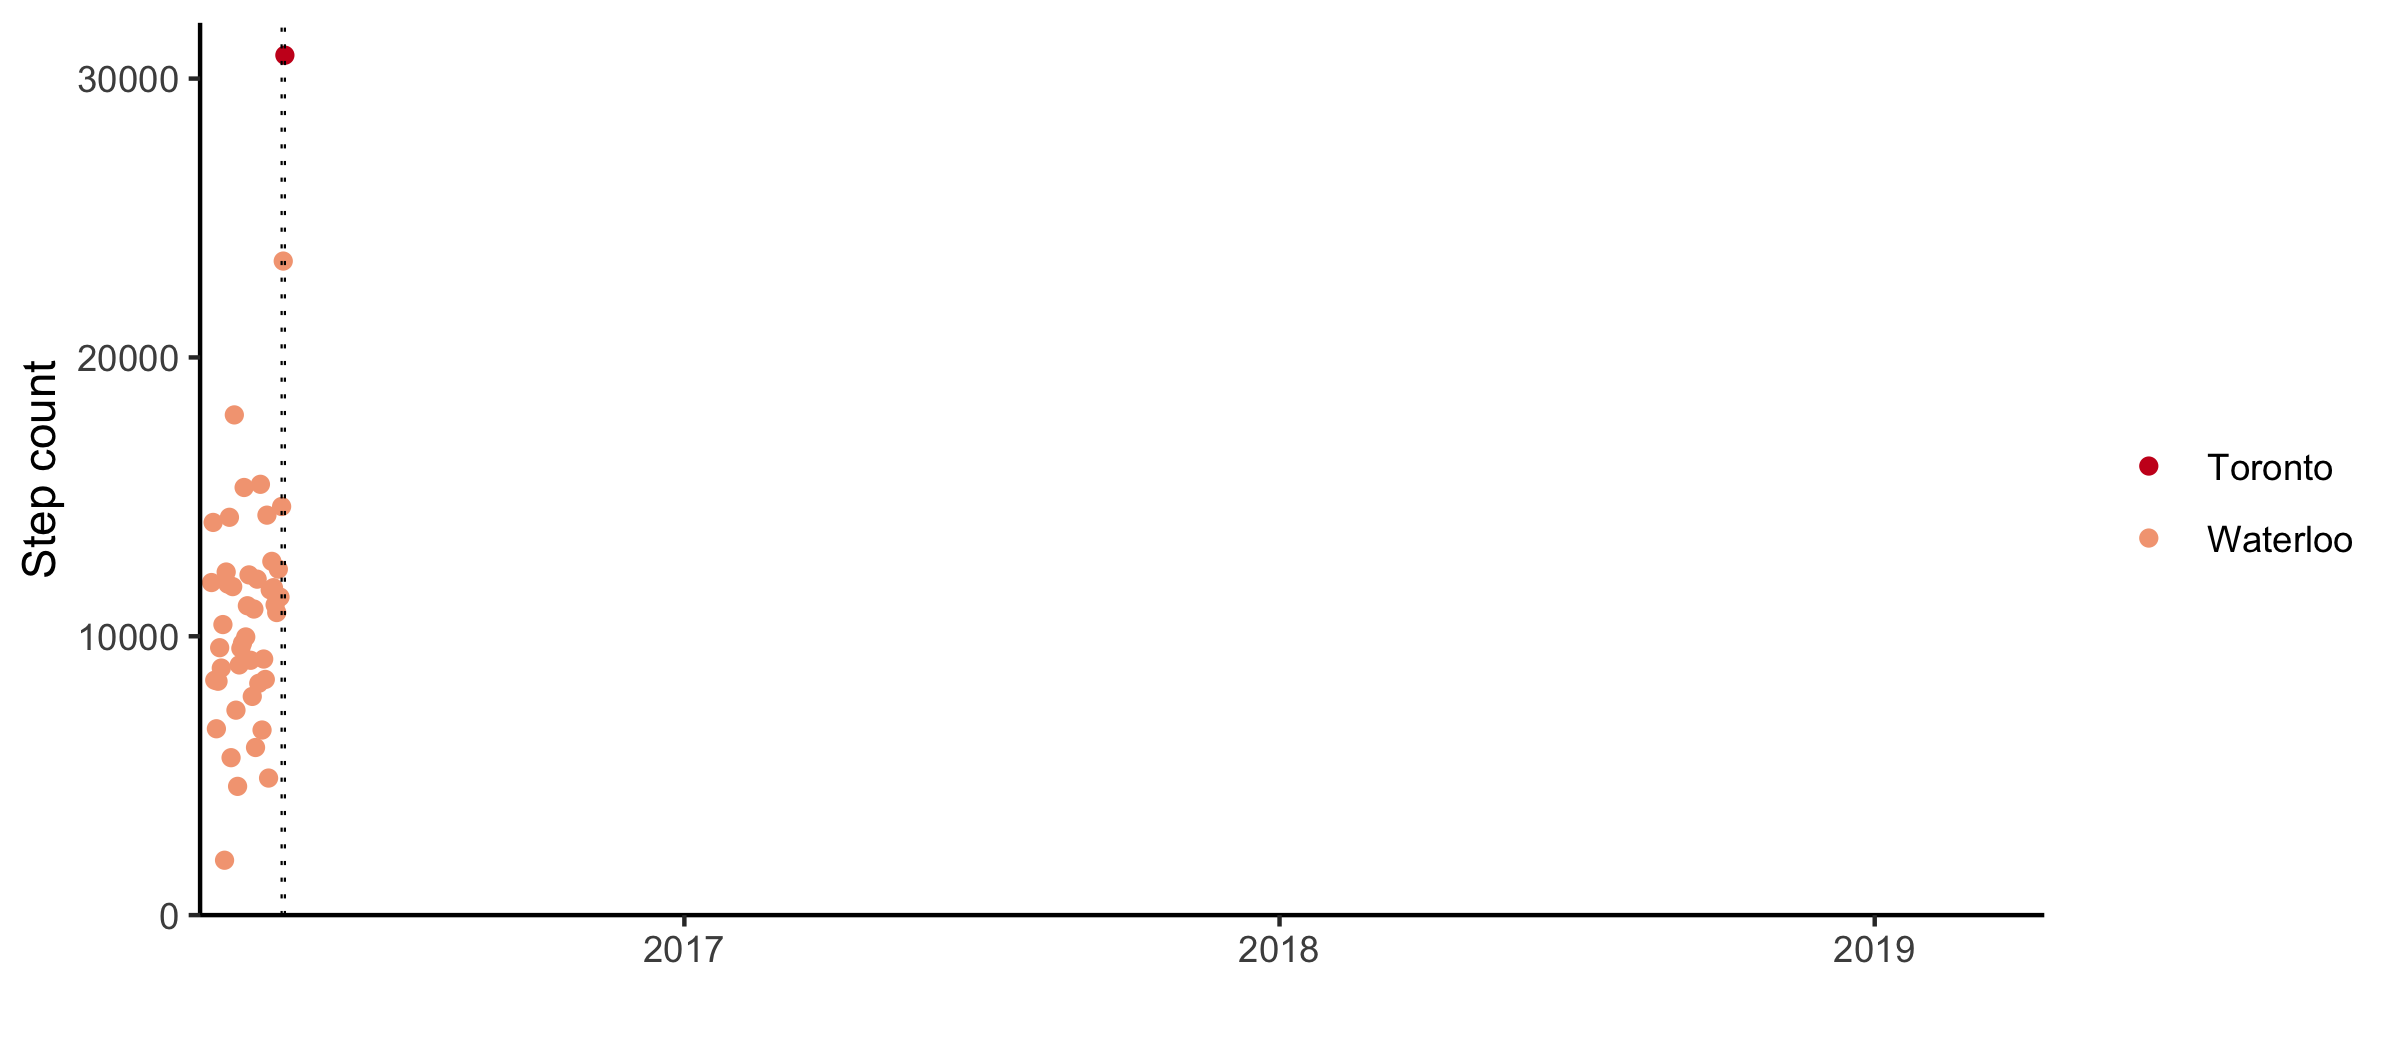
When the summer ended, I moved to a sublet at Bloor and Ossington. It was my first real encounter with the TTC, and I didn’t last long. After a particularly long day at work, I couldn’t face the subway anymore and walked home. I kept walking, buying coffee every morning. The morning after Trump got elected, I started buying large instead of regular coffee.
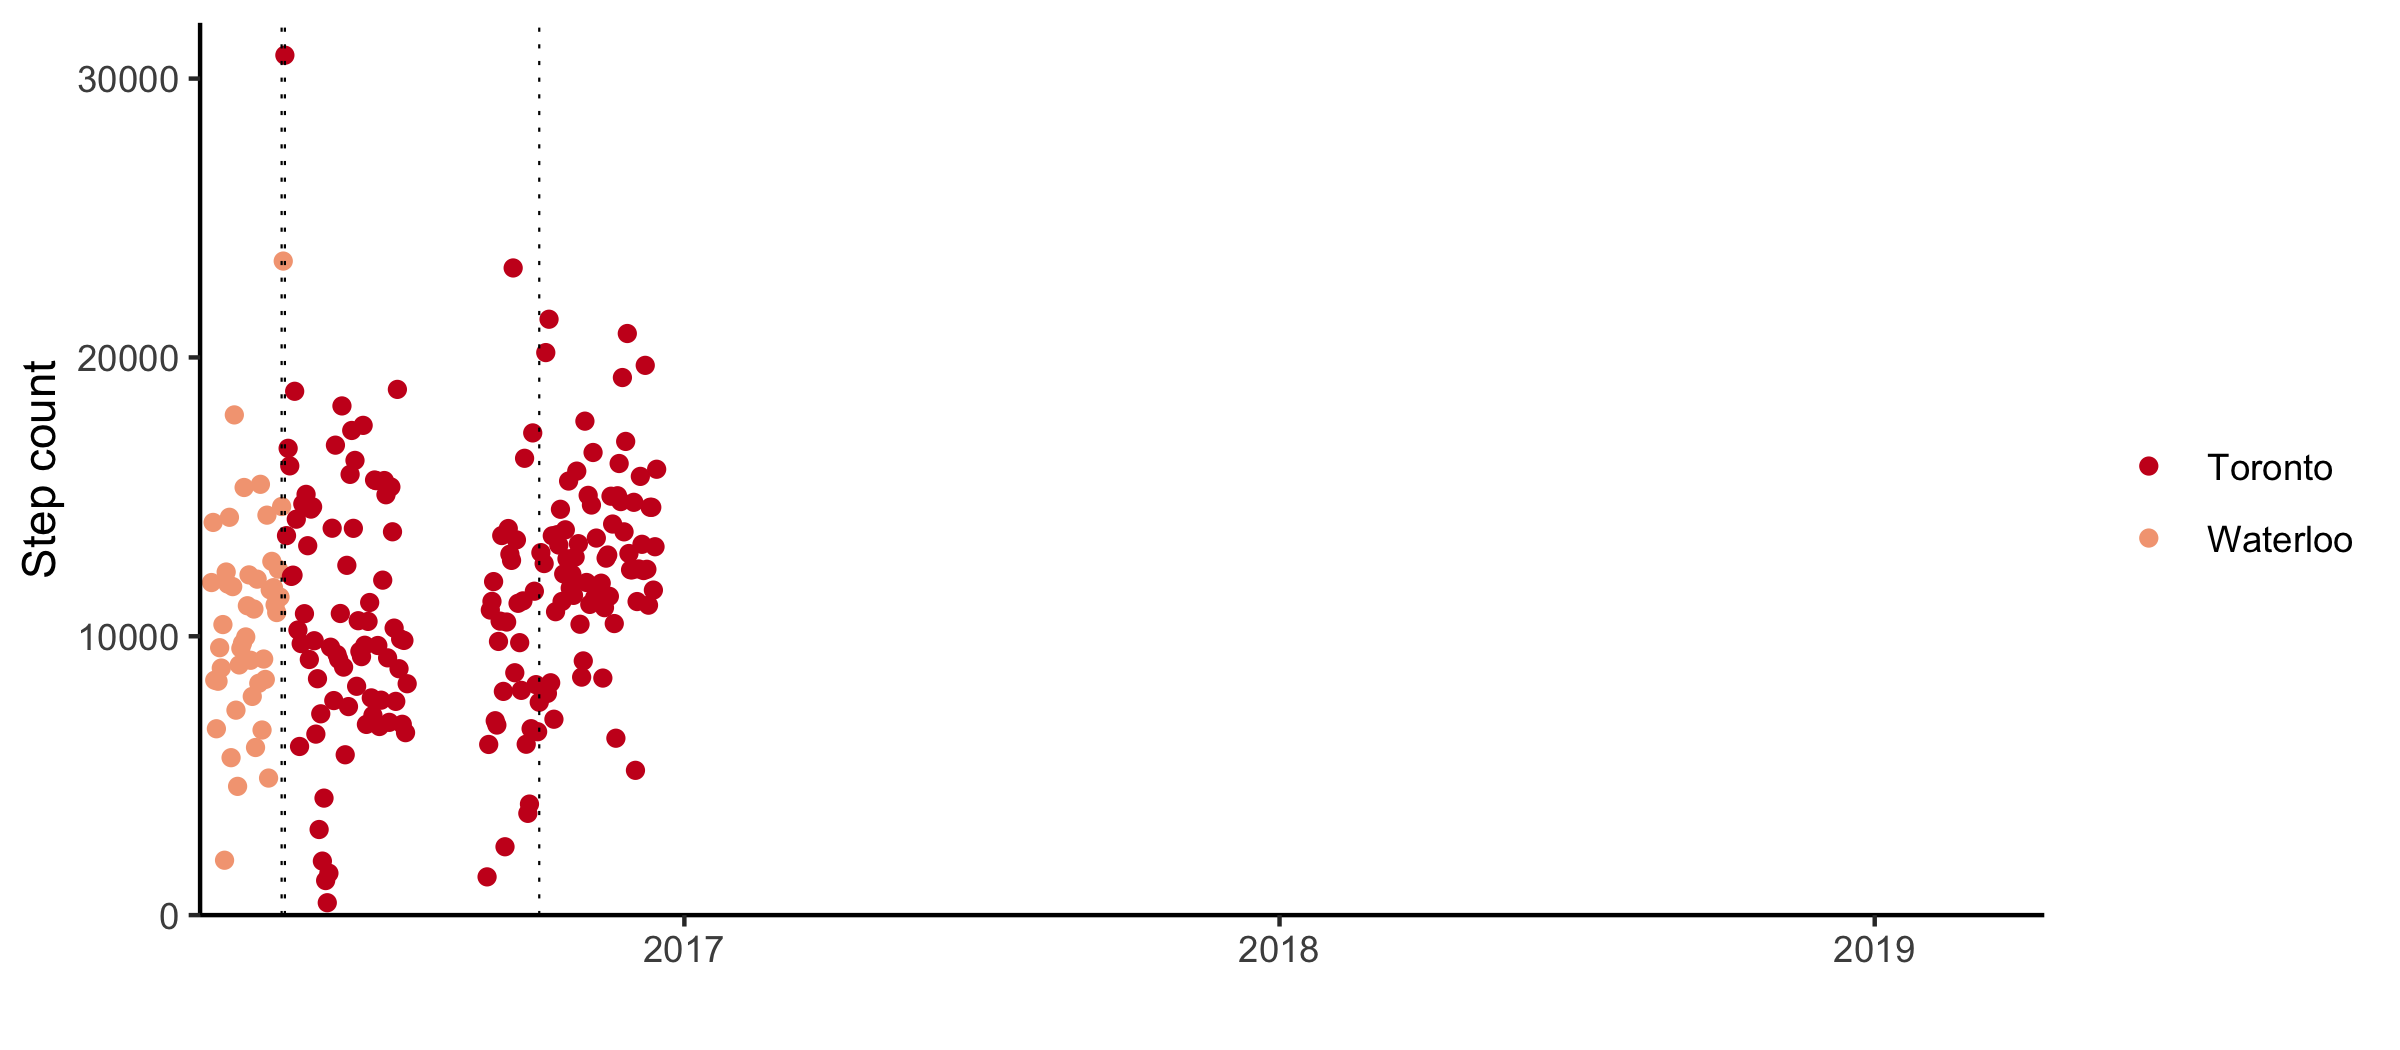
My internship ended and I moved back to Waterloo in January. I had to wrap up my master’s and find a job.
Let’s pause here to talk about my job search. That turned out to be the more difficult part. Everyone I studied with accepted positions as risk managers. I had done one internship in risk management and concluded I had no interest in risk. I wanted to continue doing biostatistics, but those jobs were much more elusive.
Without any clinical data to analyze, I started unleashing my biostatistics skills on my job search. I categorized my applications as active, rejections, or interviews and made Kaplan-Meier plots. Every time I got an interview, I would update the plot. ’
In June 2017, it looked like this:
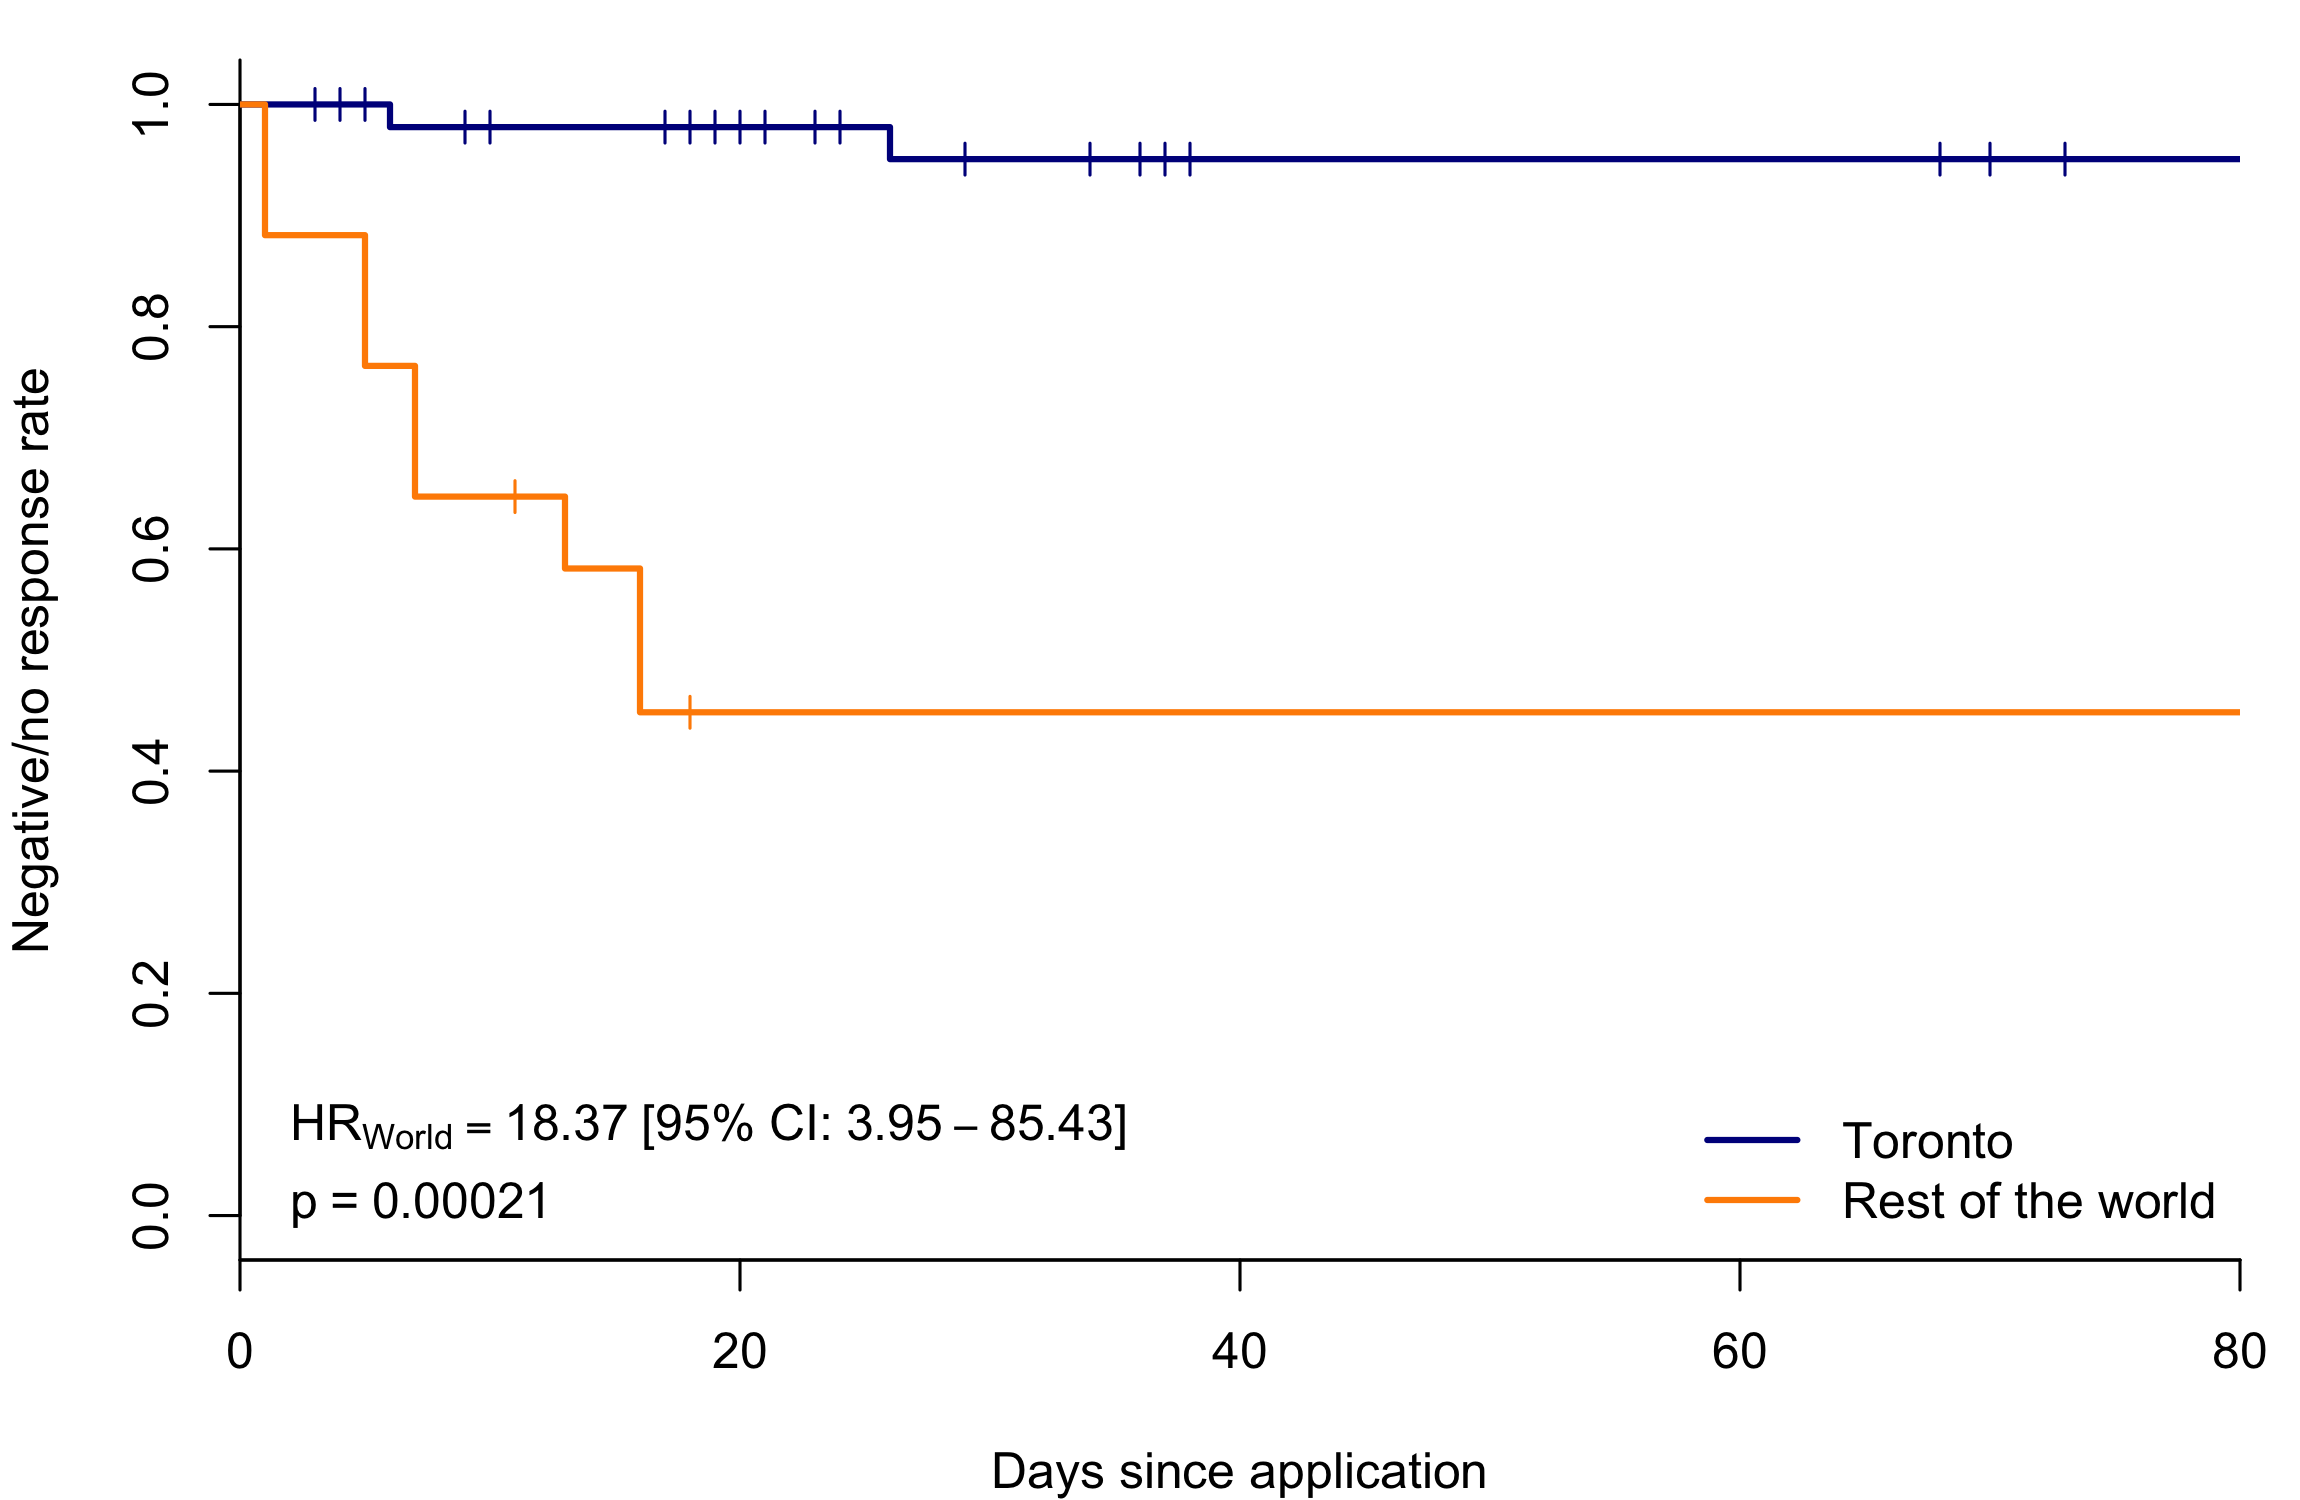
I tried to do my statistics degree justice by covariate-adjusting the result. Statistical significance doesn’t mean much by itself. This is the rationale behind randomization in clinical trials: if we want to say that a drug has an effect, we need to make sure that there aren’t any hidden factors that affect both the probability of taking the drug and the probability of responding to it.
Of course, there was no randomization in my job search. I applied to most data-related jobs I could find in Toronto, and only jobs I was really excited about elsewhere. In causal inference terms, my decision to apply for a job was a collider. It was influenced both by the location of the job, and whether I had any relevant experience.
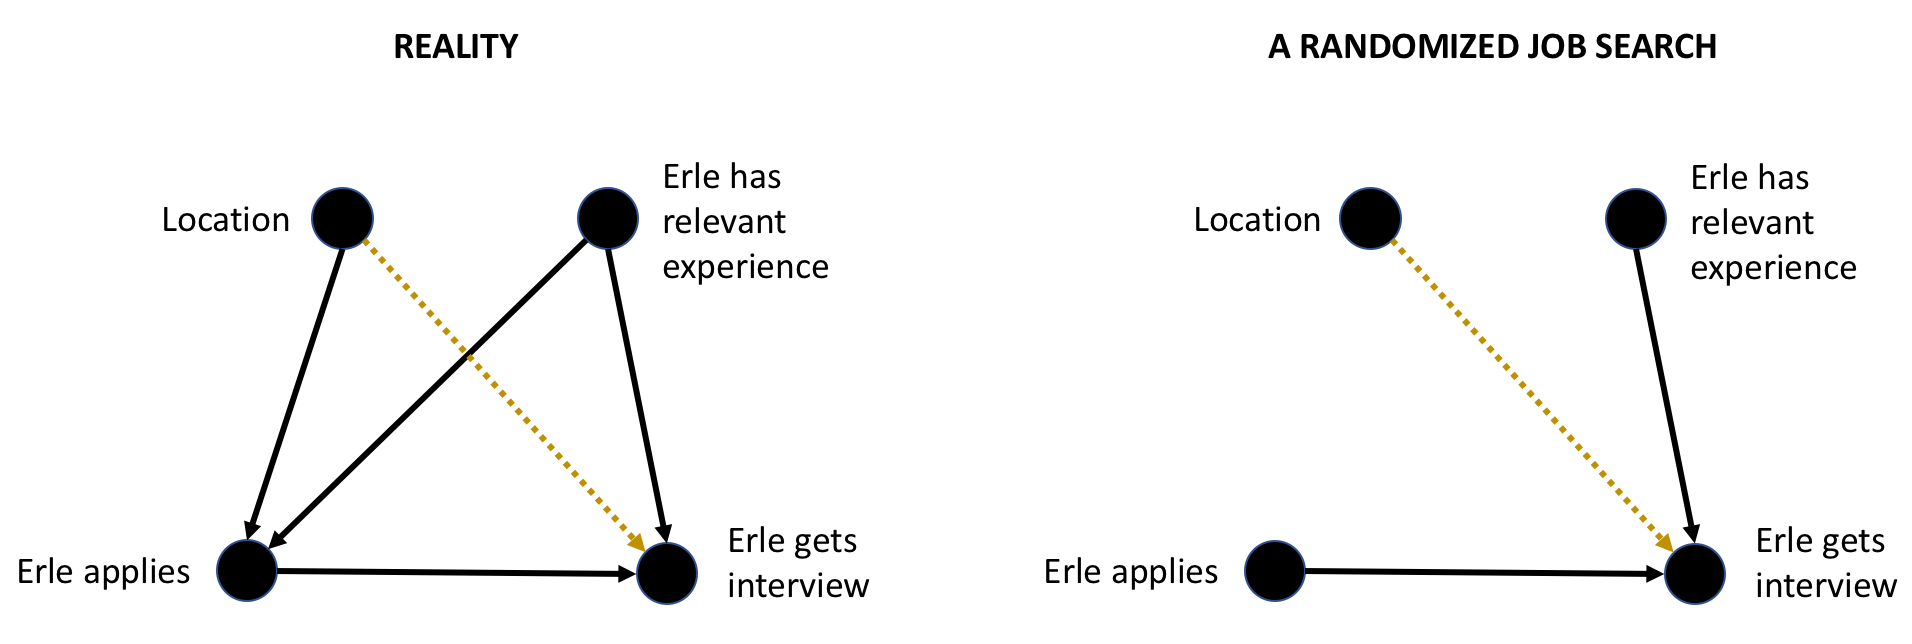
A funny thing happens when you condition on a collider: Berkson’s paradox. The variables that cause the collider become dependent, even if they originally weren’t. Since my job search data only includes jobs I actually applied to, we would expect me to have more relevant experience for any job that’s not in Toronto, and in turn be more likely to get an interview.
I tried to get around all of this by running a principal component analysis on every job listing I’d applied to, and adjusted my analysis for the first five principal components. There was still a significant location effect.
Eventually, I decided against staying in Toronto. I moved to London, England on the second of August. I’d accepted a job as a statistician at a cancer research institute in Chelsea. In a lot of ways, living in London was perfect. After spending most of my twenties moving around, I have friends in a variety of places, and everyone seems to pass through London.
It also had potential for a great life story. My mom died of breast cancer when I was eleven, and my first job out of university was in a breast cancer research institute. I told myself those two things were a coincidence.
I found a room to rent after about a month and a half. On September 20th, I moved into a house share in Whitechapel with an orchestra musician and an aspiring wonton entrepreneur. Rent was cheap by London standards. The living room had been converted into a third bedroom and the windows were single glazed. The flat downstairs had recently been broken into.
With the cheap rent and no regular income, the orchestra musician and wonton girl found themselves with the house share equivalent of golden handcuffs. They didn’t get along, but neither could afford to move out. Conflict came to a head in November after an argument about whether we could use an empty rum bottle to block mice from entering the kitchen. I stepped in as the tiebreaker, and the orchestra musician moved out.
The weirdest part of all of this was that it seemed to be normal. We listed the empty room in the house and a 31-year-old solicitor came for a viewing. My boss got married yet kept living in a house share a 40-minute commute from work.
I maxed out my generous vacation and went to visit my dad over Christmas. I visit regularly, and typically spend my days drinking copious amounts of coffee and barely leaving the house. These trips are some of the most consistent signals in my step count data. Out of the 18 changepoints, eight are associated with a trip to Norway.
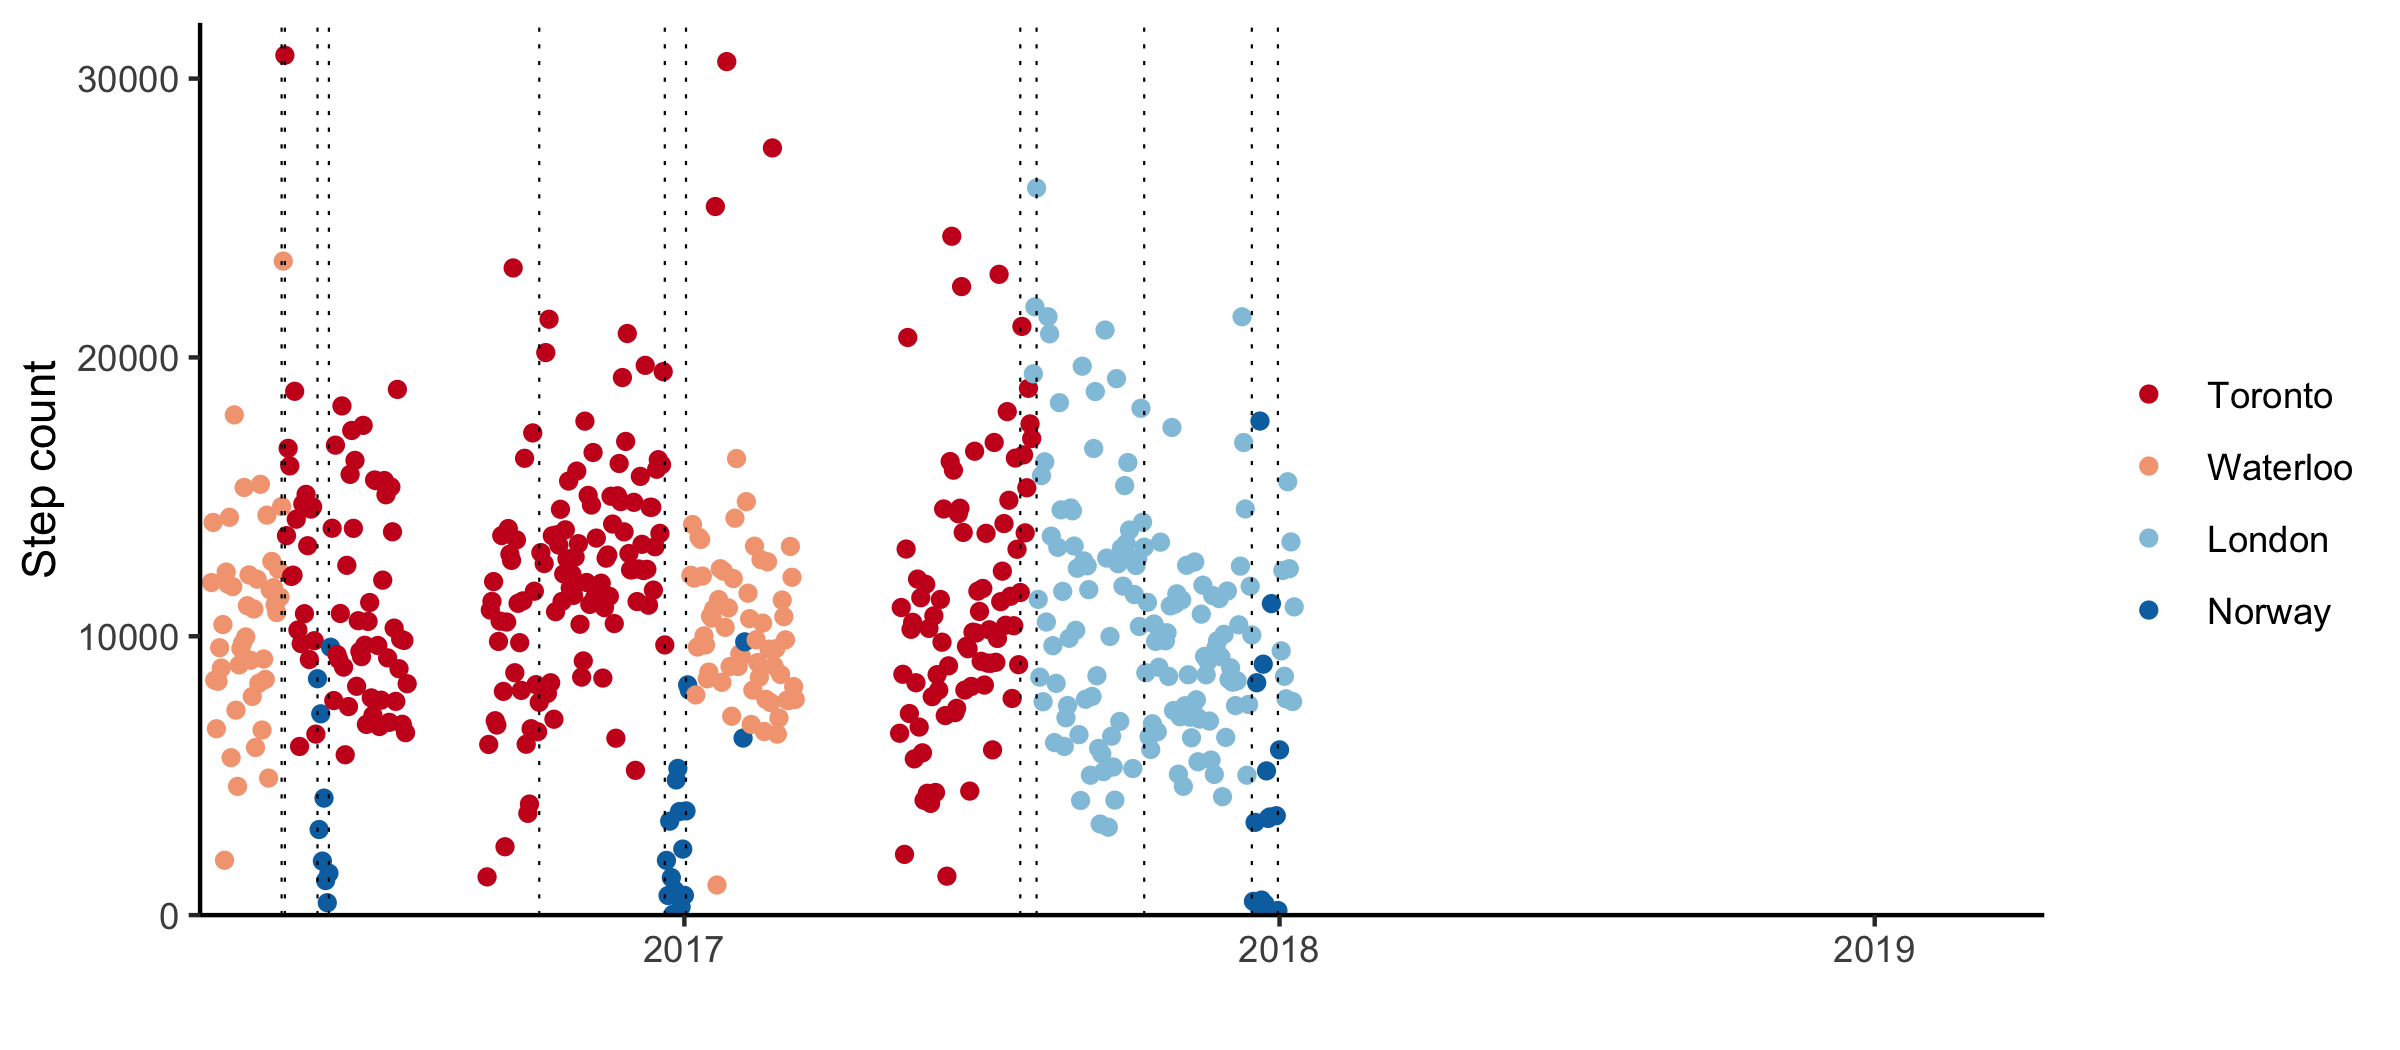
Back in London, winter hit the wonton business hard. It had its great debut in a stall in Brick Lane, selling for £1.40 per bite. It was delicious, but the eco-friendly bowls crumbled from the heat. That was the one and only outing of the wonton stand. The wonton girl started looking for an office job.
A few weeks later my friends from undergrad came to visit. We drank cocktails in Sky Garden and spent a Saturday on a Covent Garden treasure hunt. My dad and his partner also visited several times. In a display of socializing that still baffles me, they befriended a singer songerwriter who did the opening act at a concert they attended in 2016. They still visit her to this day, and we all gathered in their vegan restaurant and concert space.
I started using a machine learning analogy to explain it to people. London is what you come up with if you’re trying to optimize for your maximum happiness. Toronto is a solution to the average happiness optimization problem.
I went back to Toronto on vacation in April. I wanted to go at the worst possible time of year so I wouldn’t be tempted to skip the return flight. It was a great seven days of meeting friends and eating Asian food. Paradoxically, it was also the warmest I’d felt in months. Buildings in Canada are built to keep the cold out, whereas in my room in England temperatures would drop into the single digits.
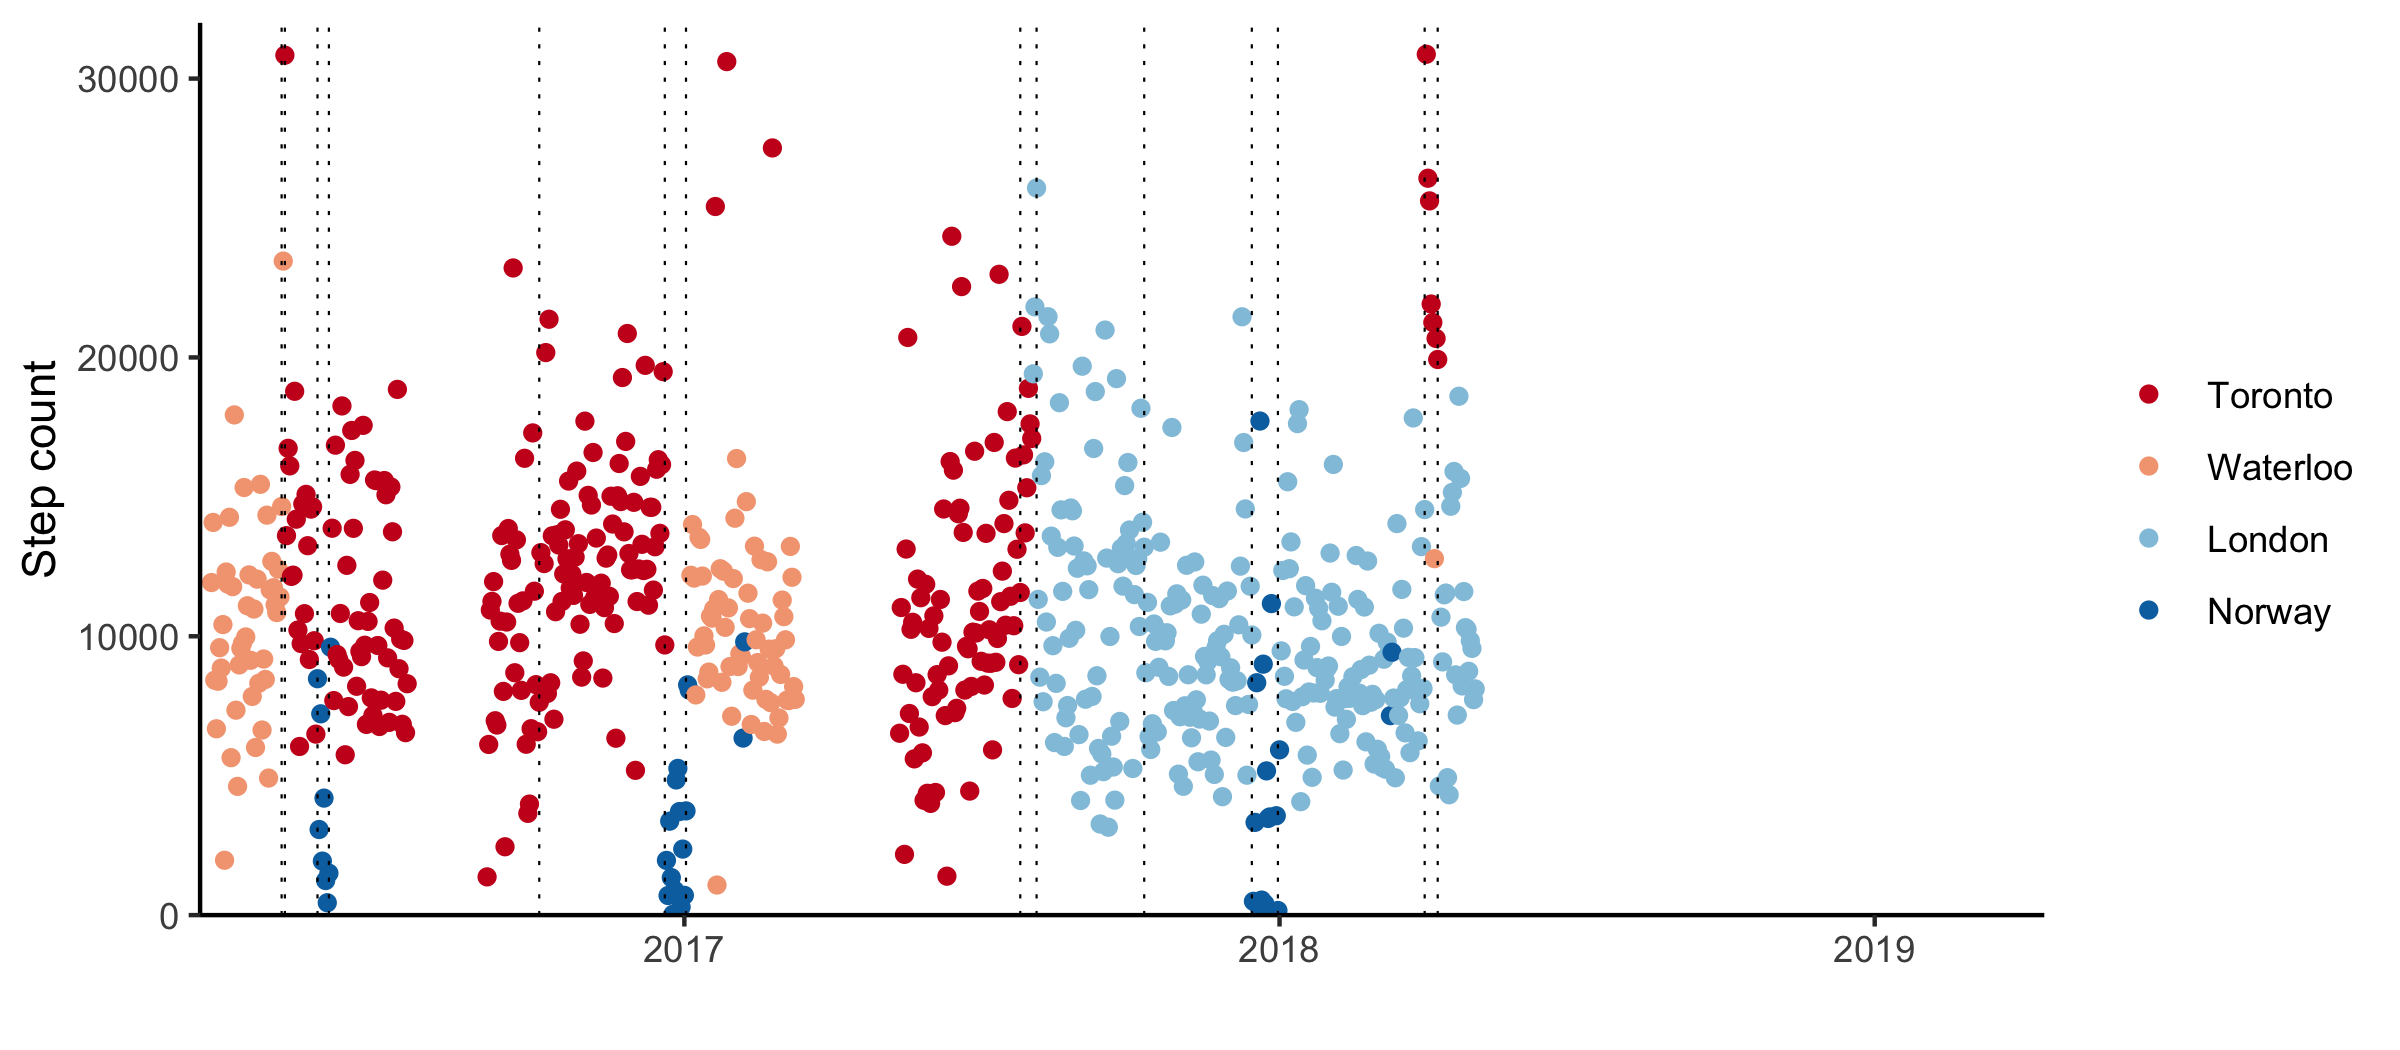
When I got back to London, it was summer. I gave up on the flat share in Whitechapel and moved to Clapham Junction. My new flatmates found me at the viewing for the apartment they were moving out of and convinced me to move in with them at their new place instead. I’m not typically that charming, and was very pleased with myself.
Soon I realized they were both trying to make a career transition into data science. They were hoping I could teach them Python. Before I’d even moved in, I got a text asking if I knew how to load data into Tableau. Overall, a small price to pay for a great place. I could walk to work.
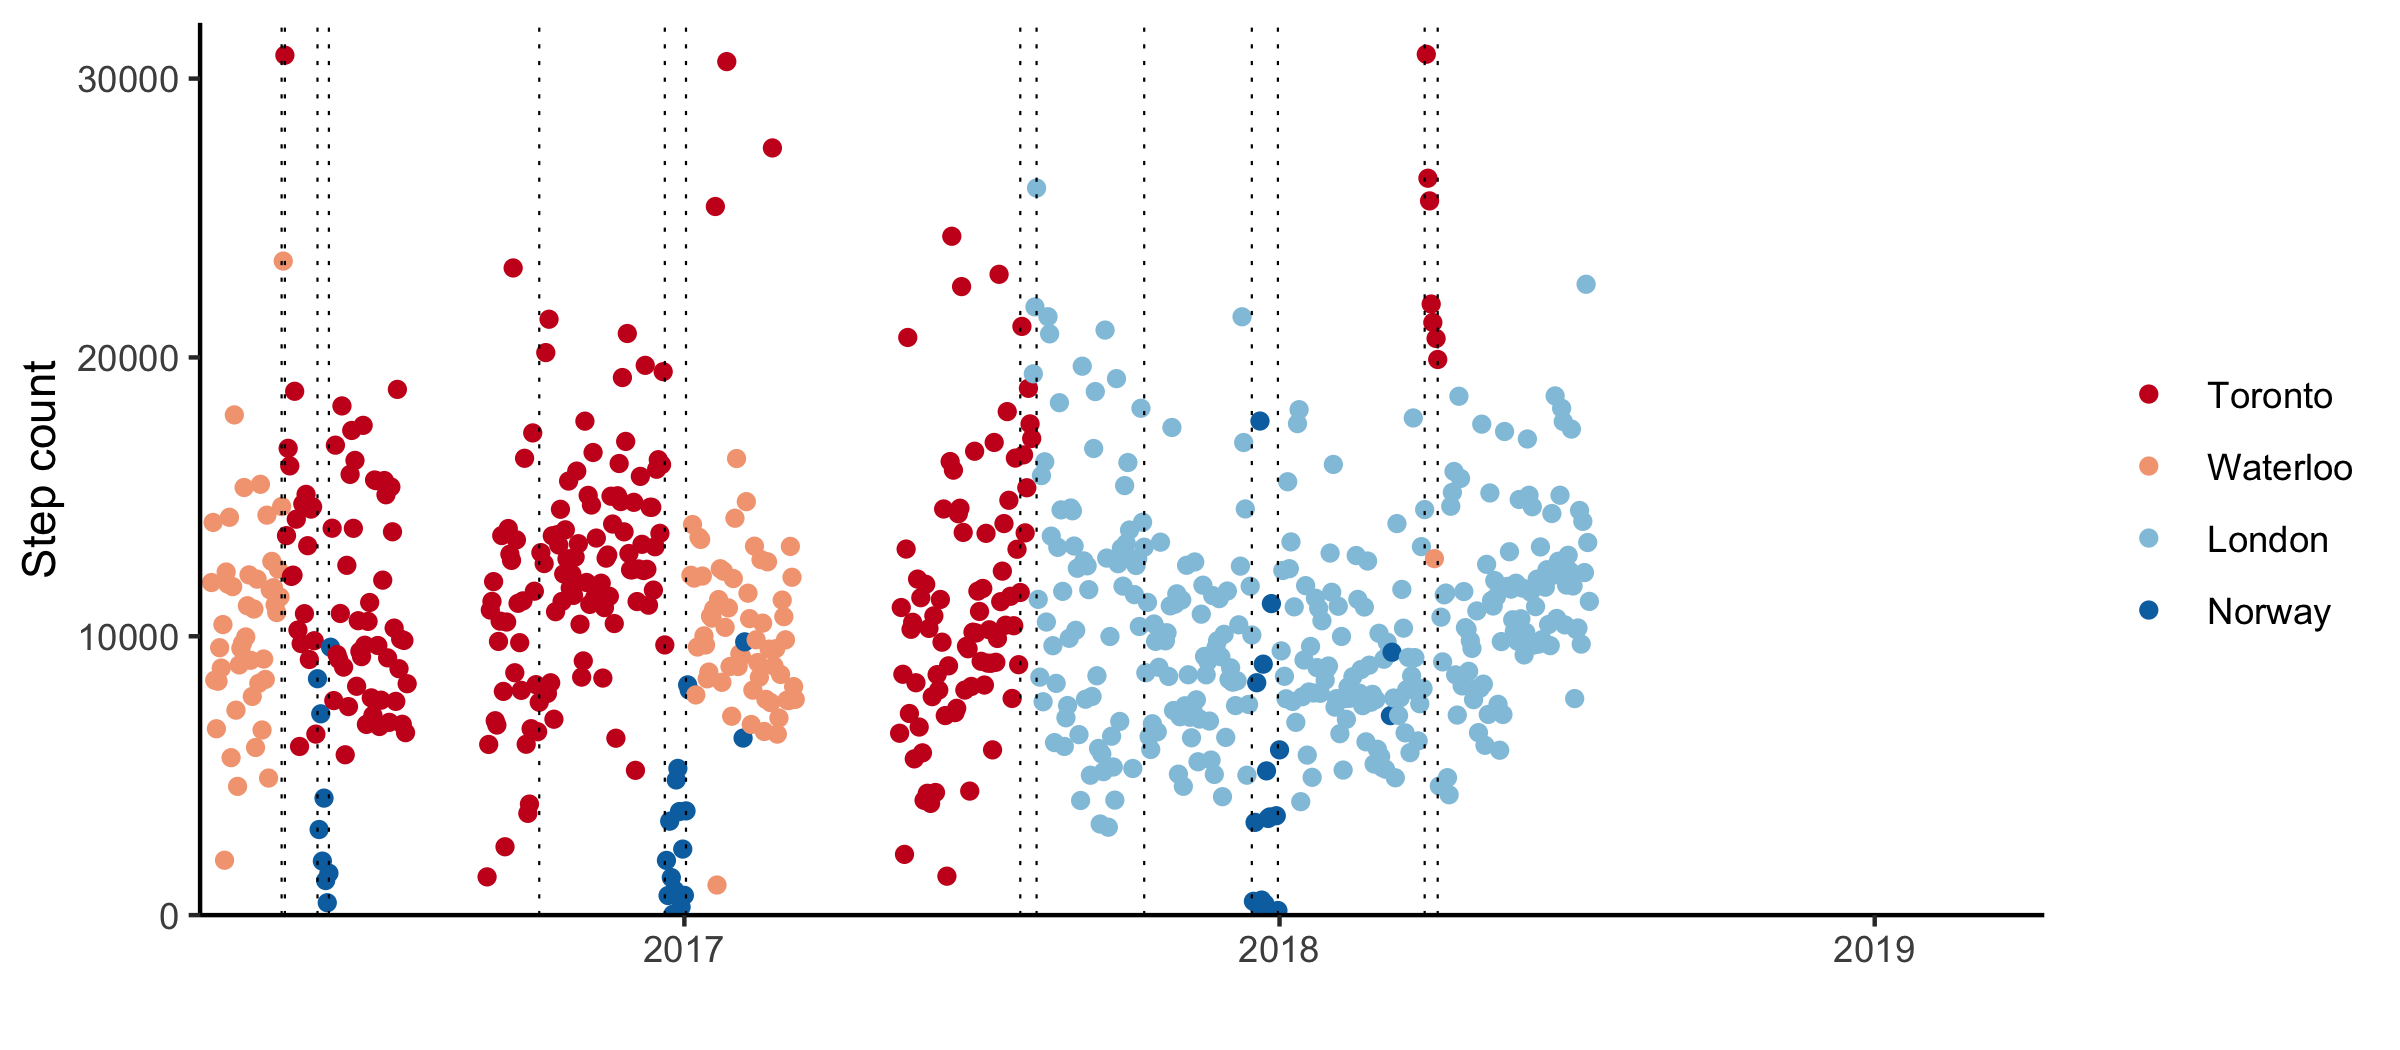
Still, my time in London didn’t last. In late July, I got a job offer from a drug development start-up in Toronto. It was a Friday night, I’d already had two drinks, and politely declined the opportunity to negotiate salary with the CEO. On my way home, I walked through Soho. It was raining and I felt ridiculously happy.
I’ve been back in Toronto for a year now. I went a month without internet and my phone stopped recording detailed step count data. I passed my probation period at work.
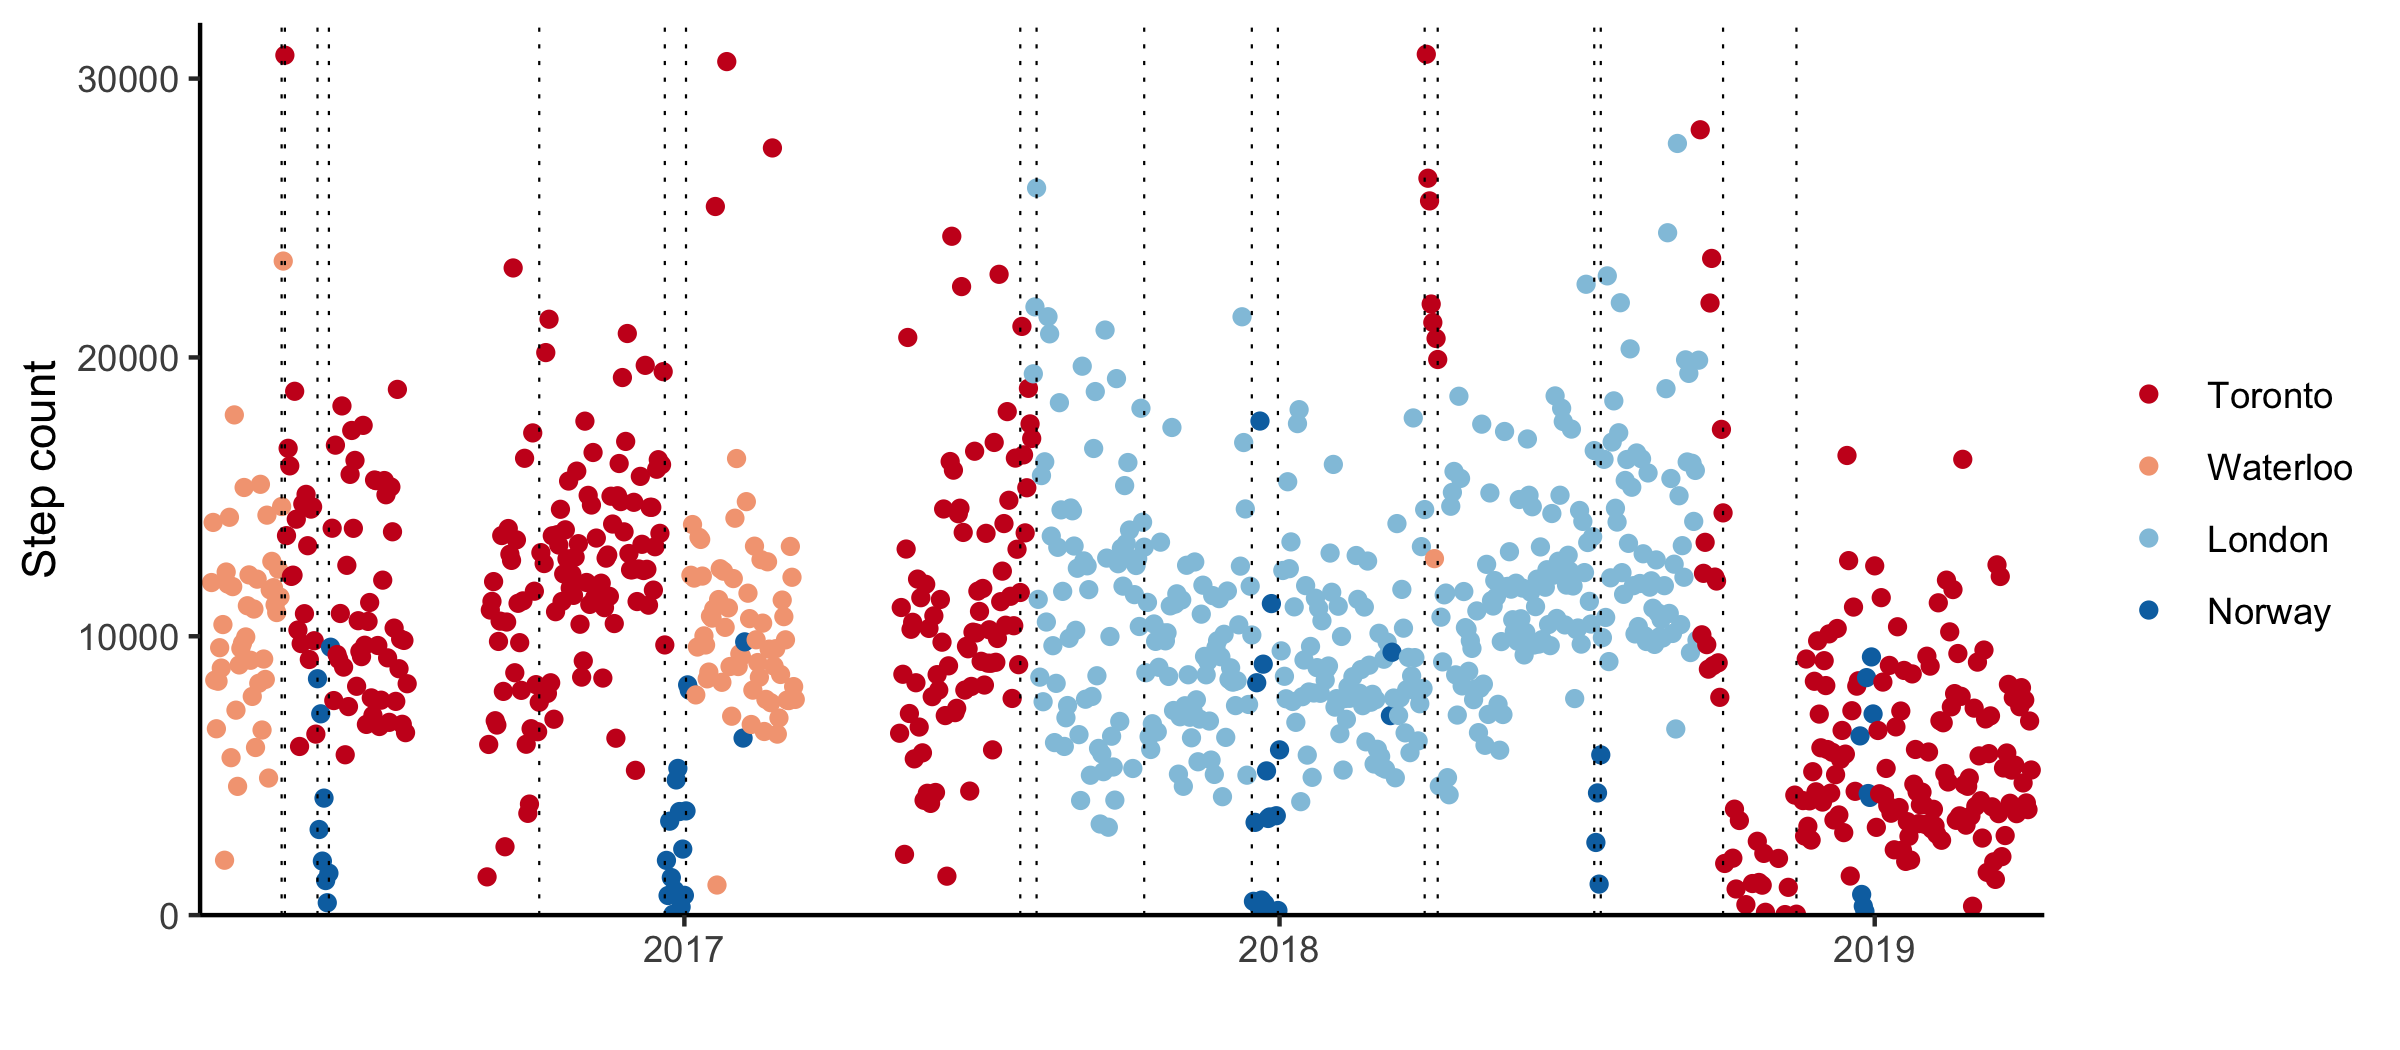
It’s been lovely.
References
Zhang NR, Siegmund DO. A modified Bayes information criterion with applications to the analysis of comparative genomic hybridization data. Biometrics. 2007 Mar;63(1):22-32.
Zou C, Yin G, Feng L, Wang Z. Nonparametric maximum likelihood approach to multiple change-point problems. The Annals of Statistics. 2014 Jun;42(3):970-1002.
Footnotes
Update: recently added to CRAN. When I originally wrote this, it had to be installed from GitHub.↩︎