How robust are ClinVar variant subsets?
How robust are ClinVar variant subsets?
In September, a new variant benchmarking preprint appeared. Lu et al. from Nadav Brandes’ group at NYU looked at a slew of new models, both sequence-to-activity and genomic language models, and how they perform at classifying specific subset of ClinVar variants. As several models have benchmarked only on the full ClinVar dataset, these subset analyses add important details on what scenarios the models perform well in.
The main results are in Figure 1.
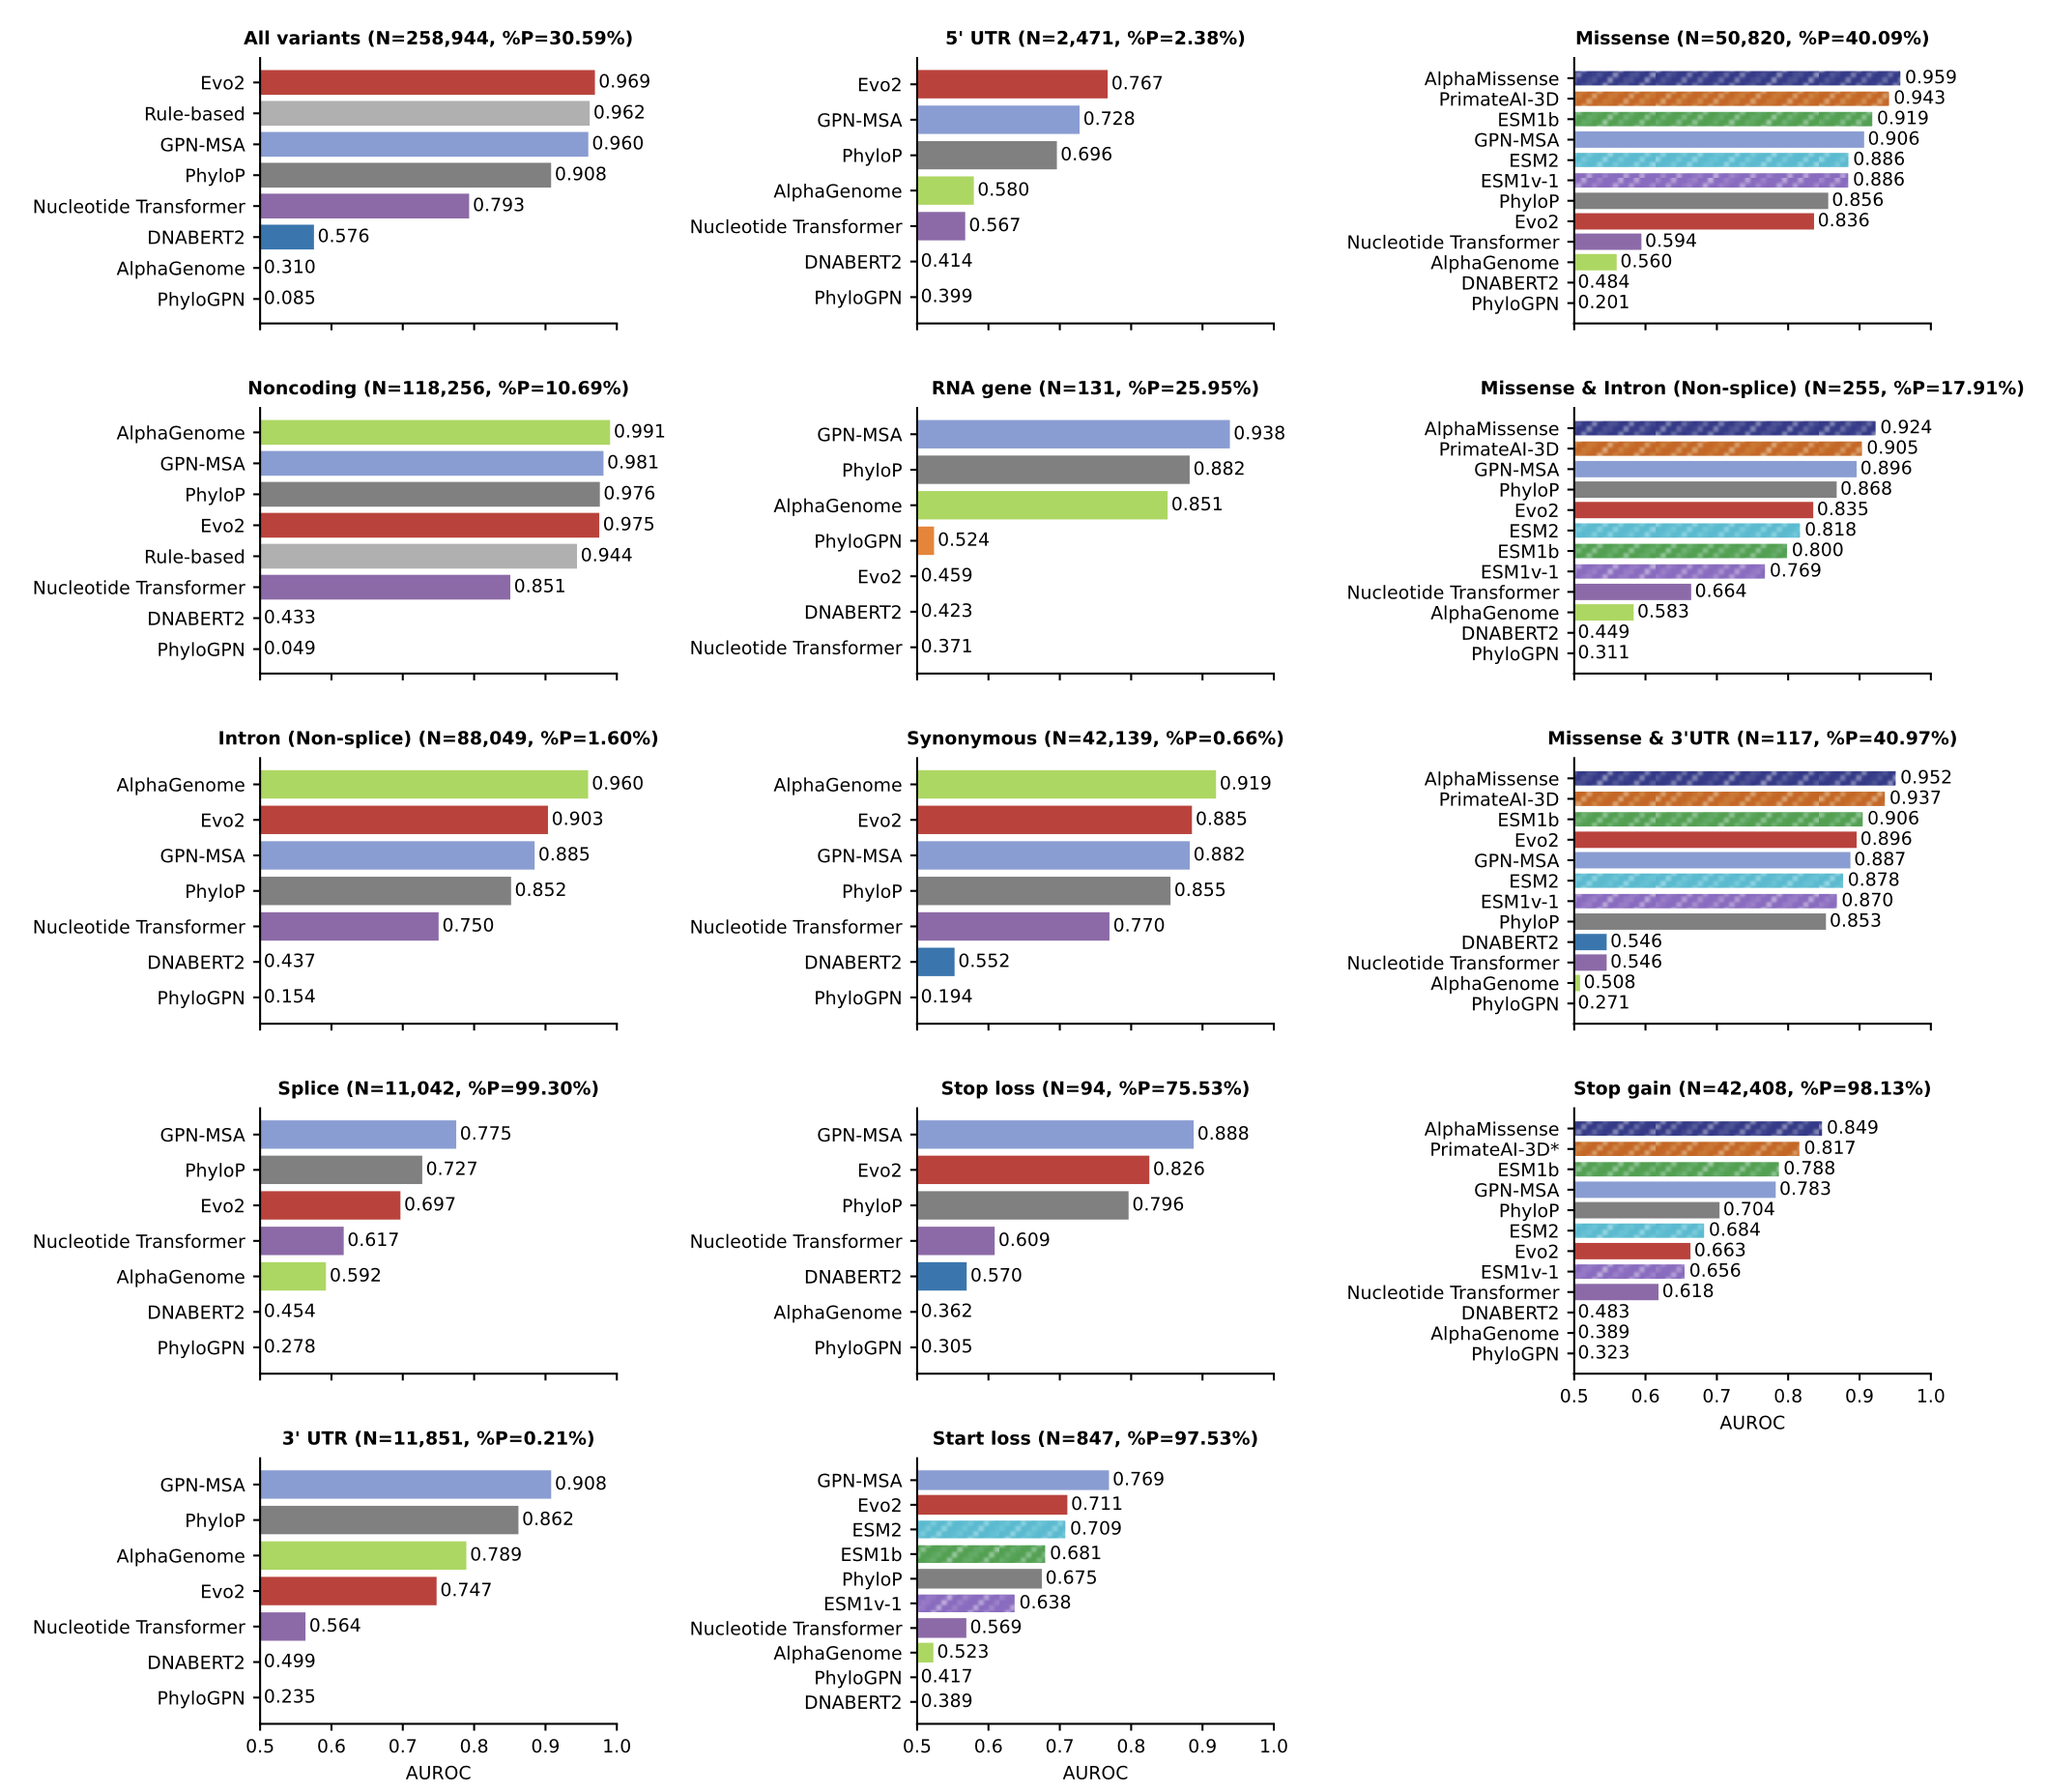
Two things stood out to me:
- No model consistently outperforms others on the non-coding variant tasks
- AlphaGenome’s performance on the splicing benchmark does not even reach AUROC of 0.6
The splicing results in particular inspired me to look more into the details. This blog post details a few separate investigations I did to make sense of the performance. What follows is a series of loosely connected vignettes: different angles I explored to try and make sense of the results. Not all of these investigations connected into a clean narrative, but each revealed something new about the robustness of the benchmarking results.
Investigation 1: Why is splicing performance so poor?
Predicting splicing variants near exon boundaries has been close to a solved problem since the release of SpliceAI in 2019. While independent benchmarking of AlphaGenome is still limited, the splicing results in the preprint were convincing and I would expect AlphaGenome to perform at least on par with SpliceAI, and have an AUROC much higher than 0.592.
The first clue to explain the subpar performance is in supplementary figure 2. AlphaGenome predicts 11 different types of output tracks, and aggregating these into a single variant score involves choices around which output tracks to consider and how to do the aggregation. For consistency, the Lu et al. paper uses the cross-modality scoring method defined in the AlphaGenome paper for all evaluations. In supplementary figure 2, they show that several variants of splicing-specific scoring methods perform better on the splicing evaluations.1 With the best splicing-specific scorer, AlphaGenome outperforms all other models.
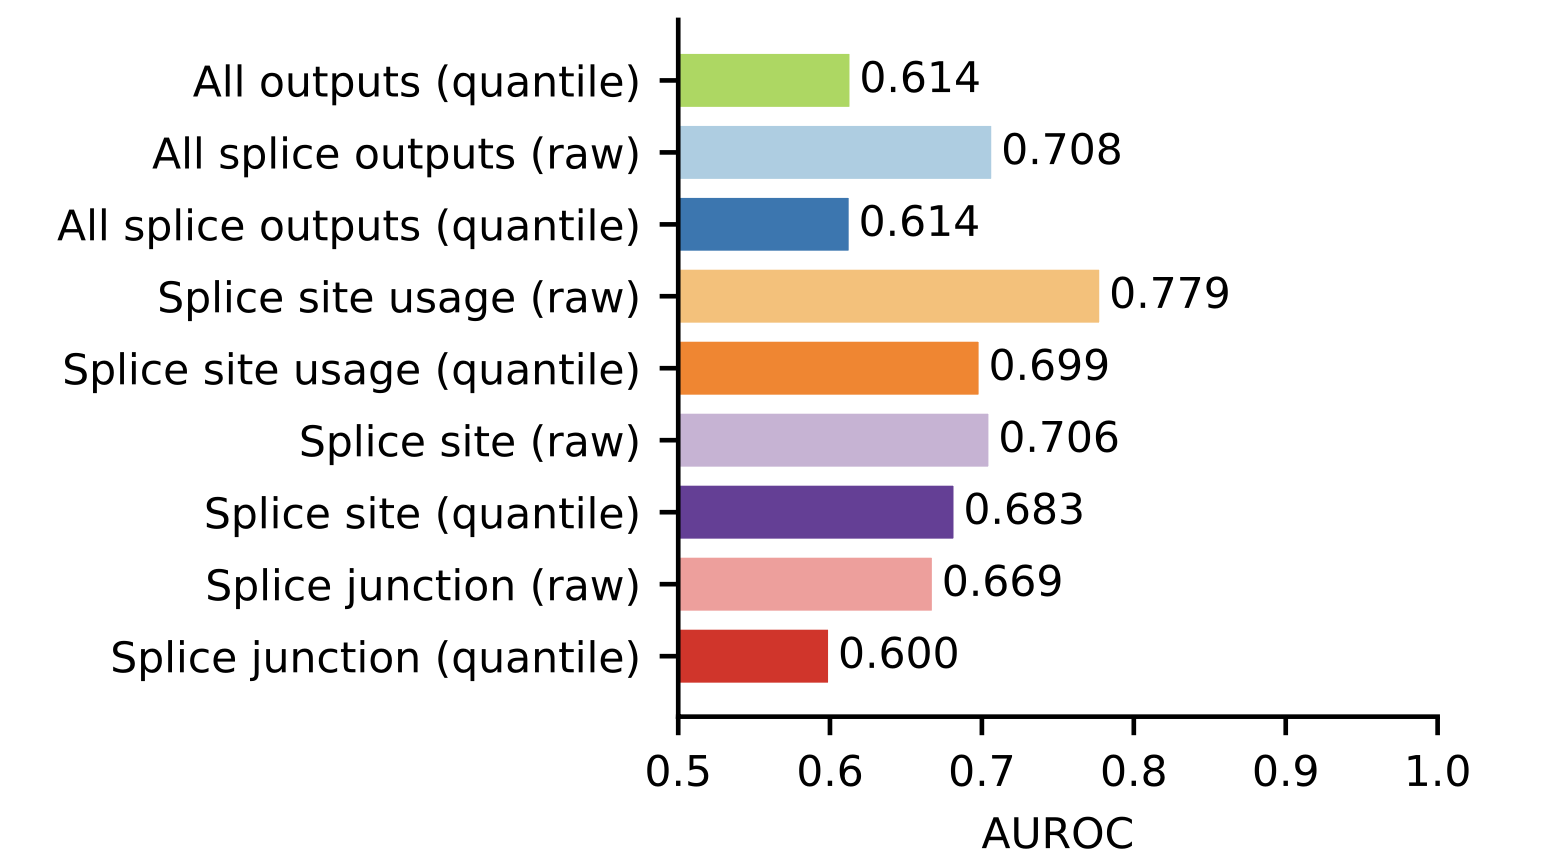
The AUROC of 0.779 is still worse than I would expect for a splicing benchmark. One possibility is the variants are defined either very narrowly or very broadly, resulting in either a particular subset task that is not representative of splicing variants as a whole, or variants that may not alter splicing being included in the benchmark.
In this case, the extreme label imbalance suggests a narrow task. The authors defined a splicing variant to be a variant that is intronic within 1-2 nucleotides of an exon boundary. In other words, only core dinucleotide variants are considered, the vast majority of which alter splicing.2 Of the 11,042 core dinucleotide variants in the dataset, only 76 are annotated as benign.
With only 76 positive variants, I embarked on an exercise of manually looking through them.
- Five (6.6%) have the reference base listed equal to the alternative base – trivially benign
- 24 (31.6%) do not overlap a splice site in all protein coding transcripts of the gene
The second point is a bit more nuanced. If a variant disrupts the core dinucleotide of a transcript that’s not expressed, we would not expect a change in splicing. Either the variant has a different pathogenic effect on the expressed transcript (e.g. a missense variant), or we would expect the variant to be benign. If the isoform is expressed, a splicing change is likely, although whether or not it’s pathogenic will depend on the resulting protein change.
![]()
The benign class has a three-fold enrichment of variants that are not annotated to be a splice site variant in all transcripts relative to the pathogenic class (31.6% vs 11.9%, p-value < \(10^{-5}\)). While not definitive proof, this suggests that there could be some ambiguity in which transcript the benign variants have an effect on.
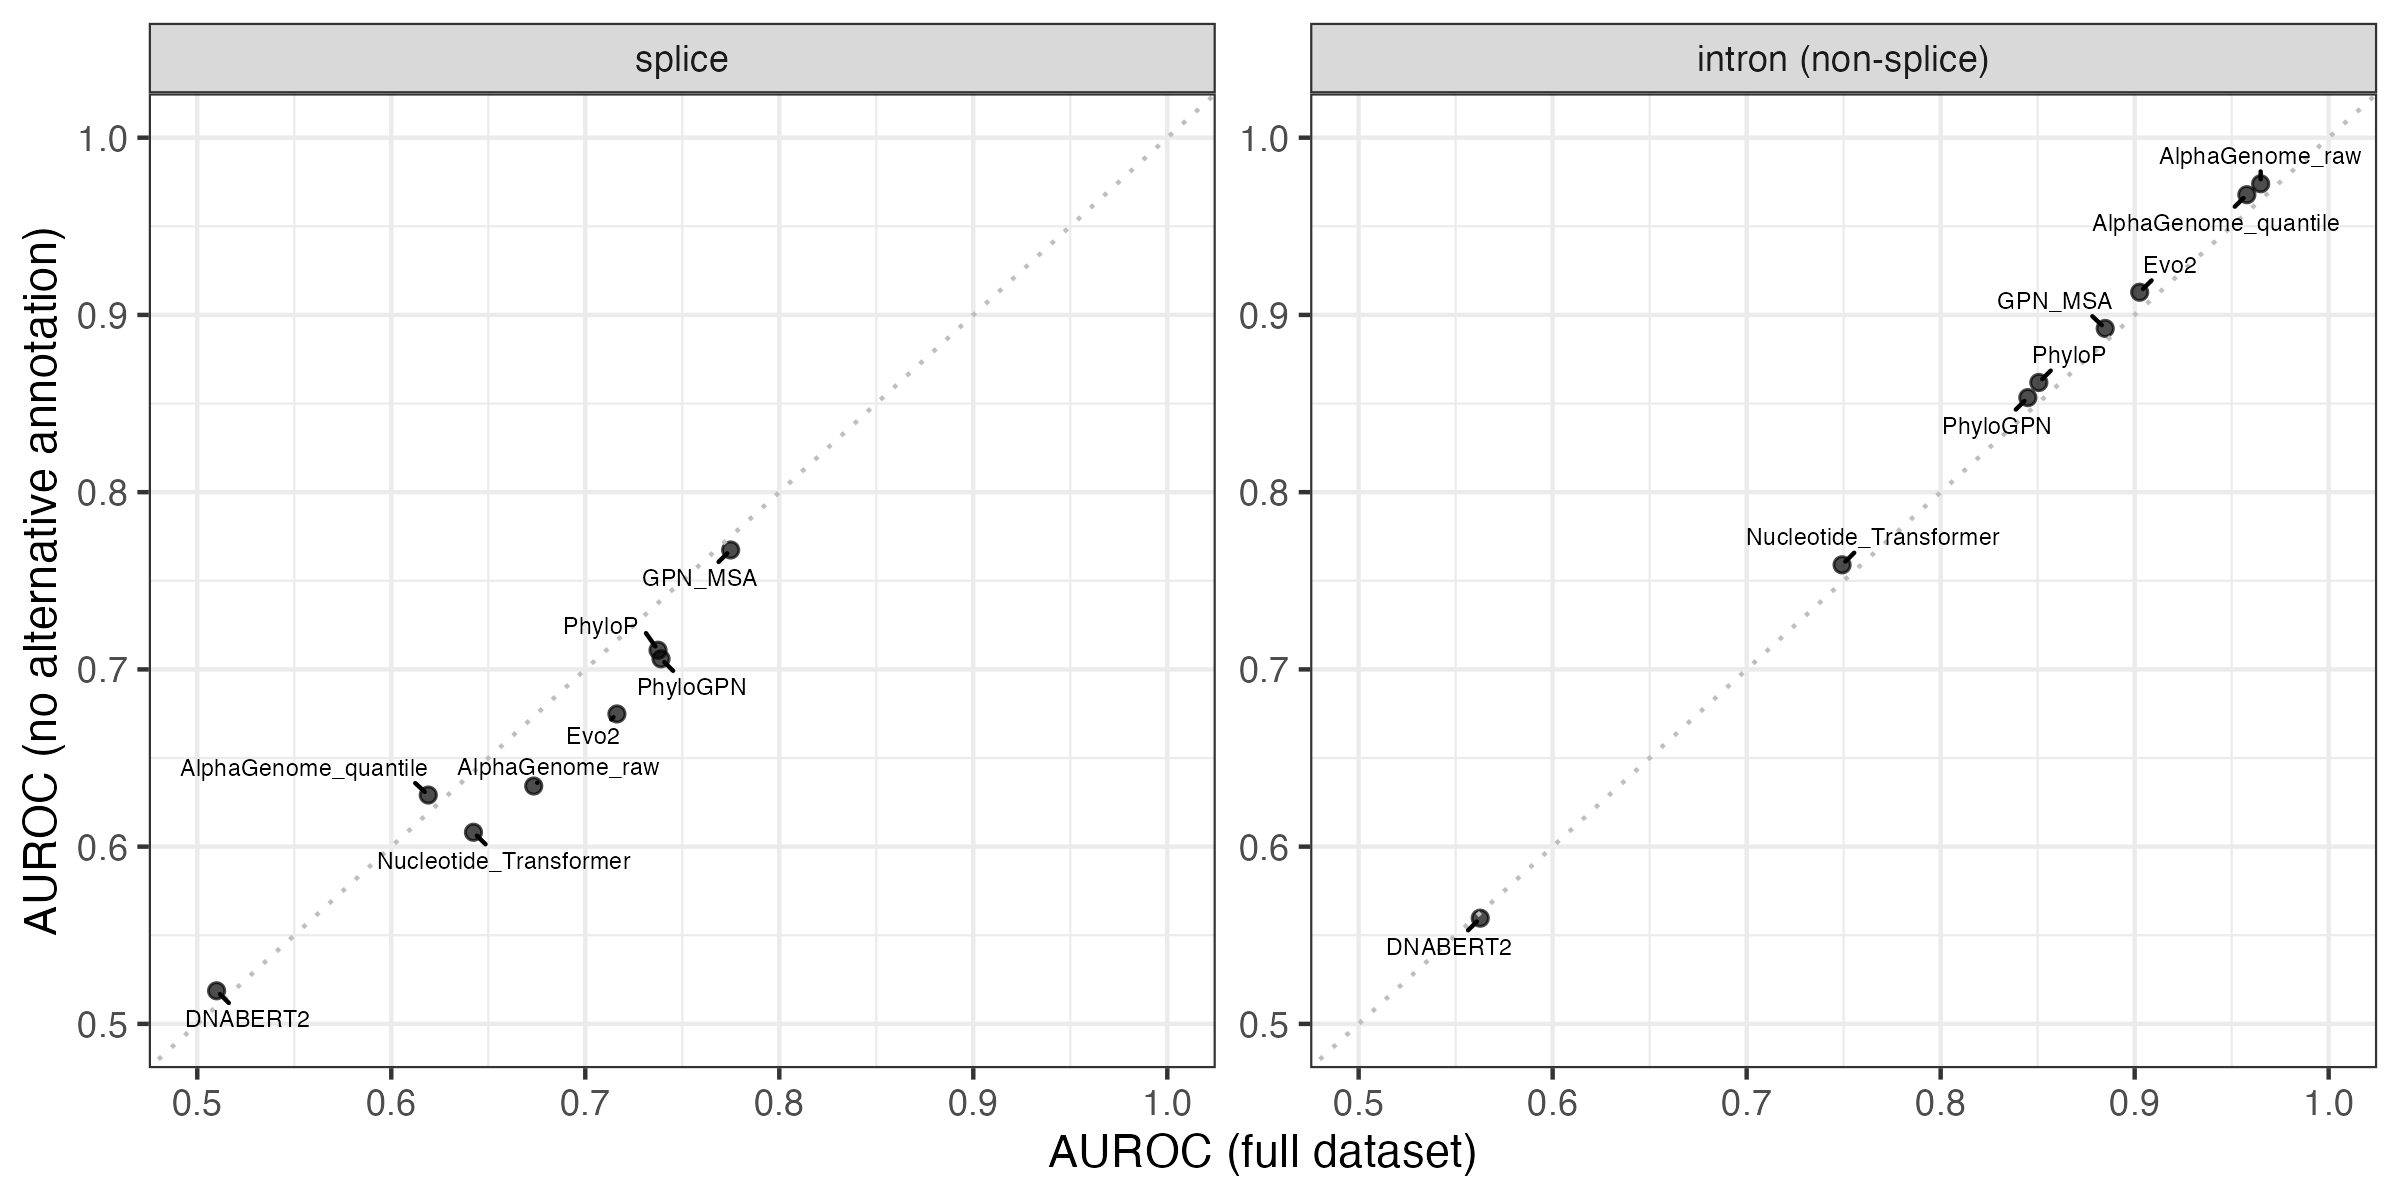
Interestingly, the intron (non-splice) group also has a statistically significant imbalance on this metric, but in the opposite direction. 96.7% of the benign variants are annotated as intronic in all protein-coding transcripts, compared to 92.4% of the pathogenic variants (p-value < \(10^{-14}\)).
While the annotation imbalance is intriguing, performance on the two benchmarks does not actually improve if we subset to variants that have the same annotation with respect to all overlapping protein-coding transcript. I expected removing the variants with ambiguous annotations would improve performance, but these results suggest the situation is more complicated.
Investigation 2: Do alternative transcript annotations affect other variant groups?
The annotation imbalance in splicing variants made me curious whether similar issues affect other variant groups. There are six variant groups with fewer than 100 variants in the minority class, five of which have fewer minority class variants than splicing.
| Variant group | Minority class | Variants in minority class |
|---|---|---|
| Start loss | Benign | 19 |
| Stop loss | Benign | 23 |
| 5’ UTR | Pathogenic | 59 |
| 3’ UTR | Pathogenic | 25 |
| Splice | Benign | 76 |
| RNA gene | Pathogenic | 34 |
The small sample sizes lead to variable AUROC estimates, and some of the models have indistinguishable performance.

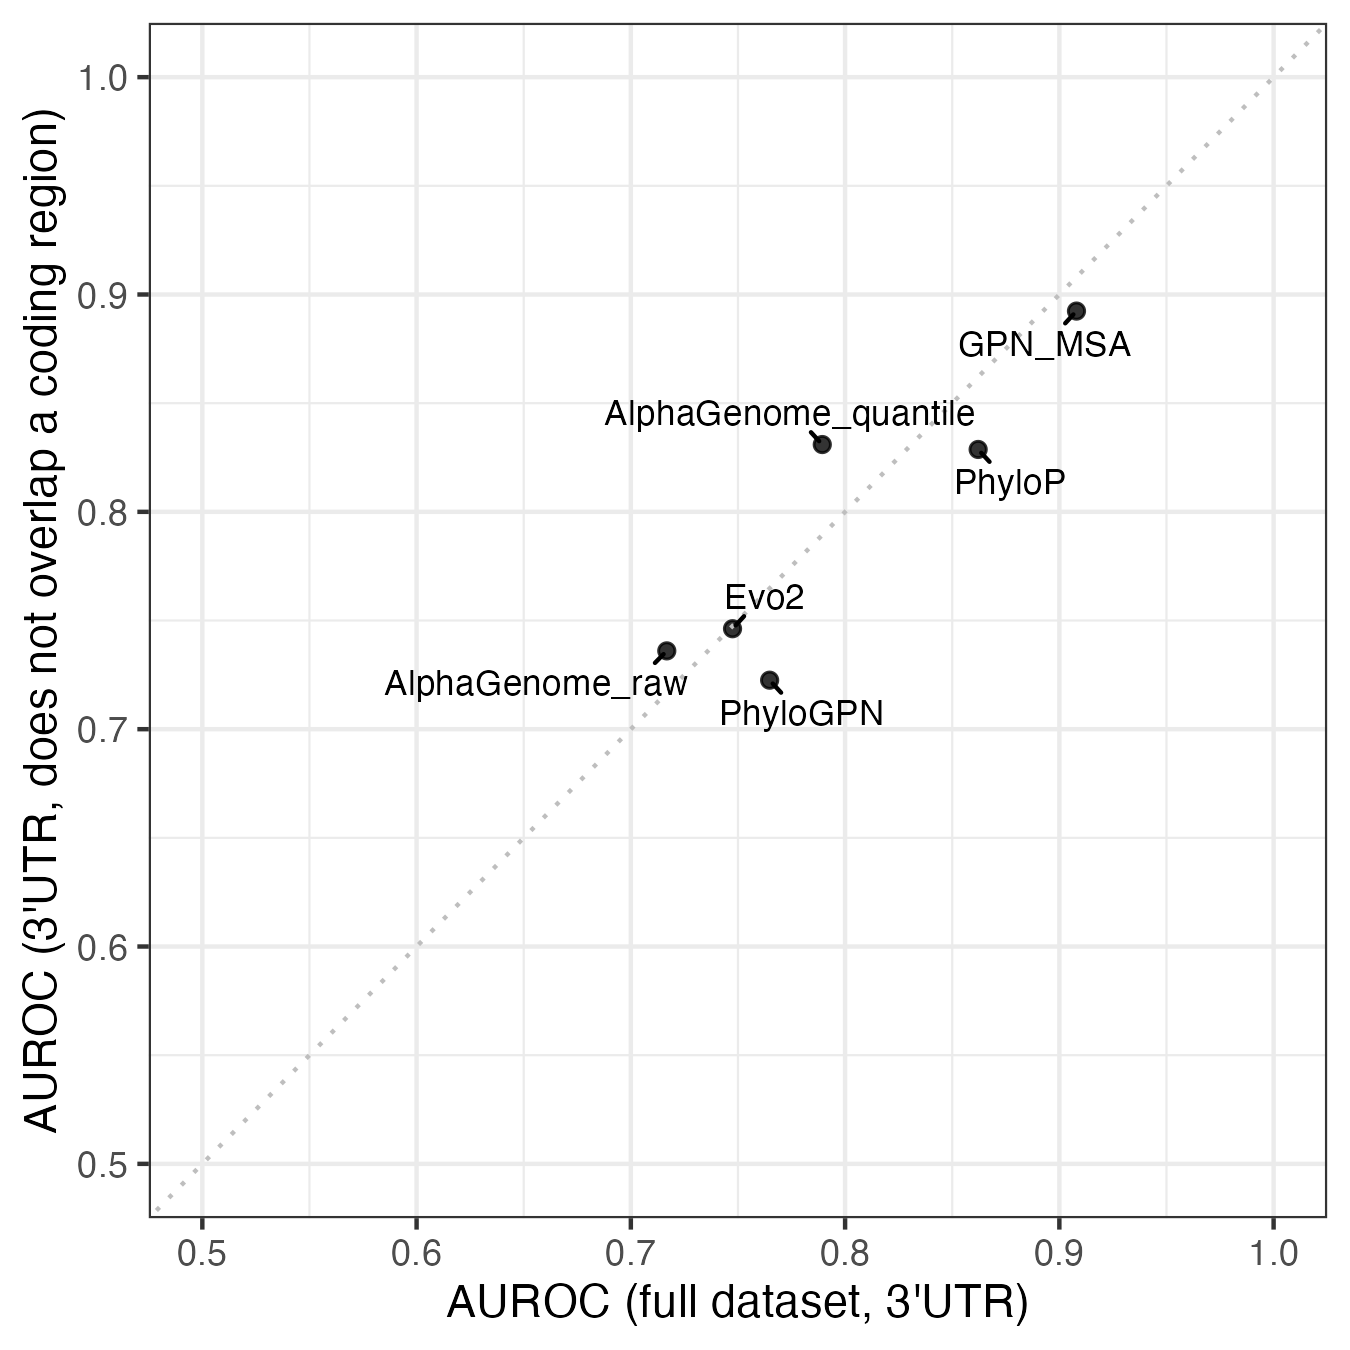
While there is variability, there’s no statistically significant difference in the variant annotations. The closest is the 3’ UTR group, where 6/25 (24%) of the pathogenic variants are annotated as something other than 3’ UTR in at least one transcript, compared to 1323/11842 (11%) of the benign variants. All six of these variants overlap the coding region of a different transcript, suggesting they could be missense variants.
| Variant | Gene | ClinVar transcript (3’ UTR) |
Alternative transcript (coding region) |
|---|---|---|---|
| chr12:25209907:A:C | KRAS | NM_033360.4 | NM_004985.5 |
| chr12:25209894:G:C | KRAS | NM_033360.4 | NM_004985.5 |
| chr12:25209905:C:T | KRAS | NM_033360.4 | NM_004985.5 |
| chr10:100827626:C:A | PAX2 | NM_000278.5 | NM_003990.5 |
| chr2:222201233:G:A | PAX3 | NM_181458.4 | NM_181460.4 or NM_181459.4 |
| chr7:155800076:G:T | SHH | NM_000193.4 | NM_001310462.2 |
The potential for 3’ UTR variants to really be missense variants matters because not all the models can predict missense effects. Genomic language models and sequence alignment models should be able to learn what variants are less likely to exist (i.e. more likely to be pathogenic), but AlphaGenome was only trained on different kinds of RNA and DNA sequencing data. It’s unlikely that any of its training data types would pick up protein-level changes, and the AlphaGenome paper makes no claims about predicting missense variants.
If we remove these six possibly missense variants, along with the 157 benign variants that overlap a coding region, performance increases for AlphaGenome and decreases for most of the other models.
Investigation 3: How do ClinVar quality ratings affect results?
Beyond annotation ambiguity, I wanted to explore whether overall data quality played a role. ClinVar itself uses a gold star system to rate the strength of the submissions, ranging from unrated to four stars. In the Lu dataset, 56% of the variants have no stars or one star.
| Stars | Number of variants | Percentage of variants (%) |
|---|---|---|
| None | 19,254 | 7.4 |
| 1 | 128,365 | 49.4 |
| 2 | 106,222 | 40.9 |
| 3 | 5,740 | 2.2 |
| 4 | 19 | 0.007 |
If we restrict analysis to the 111,981 variants with 2 or more stars, performance of the best model improves for all groups. The gains are particularly large for 5’ and 3’ UTR, where Evo2 becomes the best performer in both.

Conclusion
With the limited number of variants in each group, there can be considerable variability in performance estimates. Datasets with only a few dozen variants in the minority class are particularly sensitive to mislabelling or annotation ambiguity. ClinVar also has other known limitations, such as not being representative of common variants, as Anshul Kundaje highlighted in his Twitter thread. More curation effort may be needed to come up with robust mechanism-specific benchmarks.
Still, the overarching results in the Lu et al. preprint are robust to the different filtering strategies I tried. Across quality and annotation filters, the key conclusion holds: there is no universally best model across variant groups, even within the non-coding variant category. This suggests that choosing a model requires benchmarking on the specific variant type of interest.
Footnotes
The difference here (AUROC = 0.592 to 0.779) is huge and worth an exploration of its own. Benchmarking the best scoring method for tasks may offer better return on investment for improving model performance than training new models.↩︎
A 2024 study by Oh et al. found 17% of core dinucleotide variants did not cause a change in splicing.↩︎